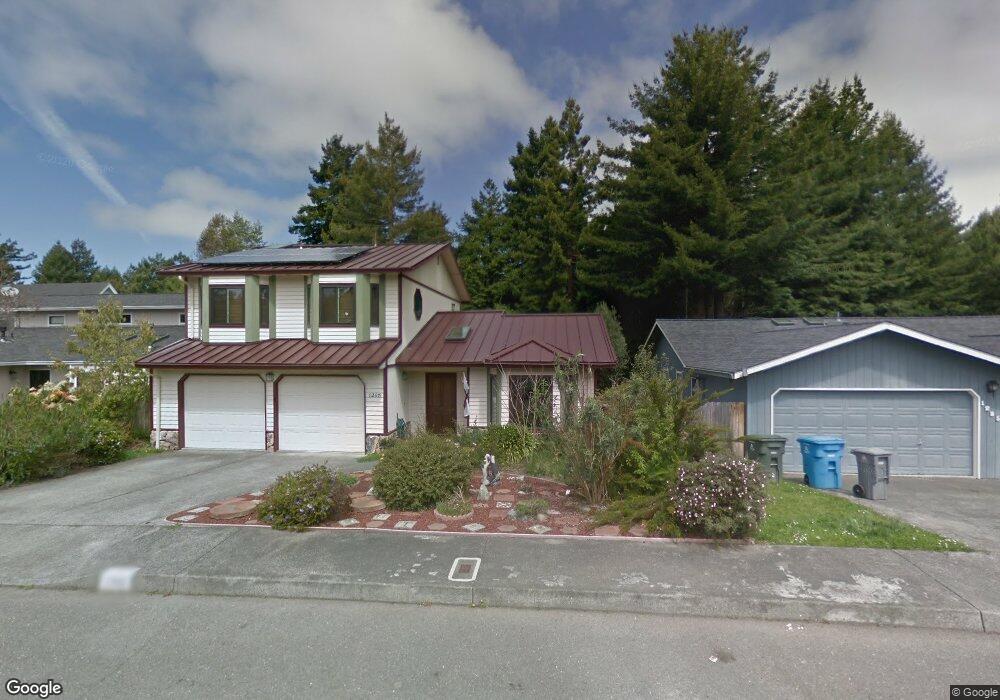
1265 Leslie Rd Eureka, CA 95503
Estimated Value: $511,878 - $574,000
3
Beds
2
Baths
1,760
Sq Ft
$305/Sq Ft
Est. Value
About This Home
This home is located at 1265 Leslie Rd, Eureka, CA 95503 and is currently estimated at $536,470, approximately $304 per square foot. 1265 Leslie Rd is a home located in Humboldt County with nearby schools including Cutten Elementary School, Ridgewood Elementary School, and Northern United - Humboldt Charter School.
Ownership History
Date
Name
Owned For
Owner Type
Purchase Details
Closed on
Jan 9, 2013
Sold by
Herring Donna
Bought by
Herring Donna and Donna Herring Revocable Trust
Current Estimated Value
Purchase Details
Closed on
Oct 17, 2001
Sold by
Tol Bill and Tol Carol
Bought by
Herring Donna
Home Financials for this Owner
Home Financials are based on the most recent Mortgage that was taken out on this home.
Original Mortgage
$182,500
Outstanding Balance
$70,027
Interest Rate
6.62%
Estimated Equity
$466,443
Create a Home Valuation Report for This Property
The Home Valuation Report is an in-depth analysis detailing your home's value as well as a comparison with similar homes in the area
Purchase History
| Date | Buyer | Sale Price | Title Company |
|---|---|---|---|
| Herring Donna | -- | None Available | |
| Herring Donna | $195,000 | Fidelity National Title Co |
Source: Public Records
Mortgage History
| Date | Status | Borrower | Loan Amount |
|---|---|---|---|
| Open | Herring Donna | $182,500 |
Source: Public Records
Tax History
| Year | Tax Paid | Tax Assessment Tax Assessment Total Assessment is a certain percentage of the fair market value that is determined by local assessors to be the total taxable value of land and additions on the property. | Land | Improvement |
|---|---|---|---|---|
| 2025 | $3,402 | $337,932 | $88,625 | $249,307 |
| 2024 | $3,402 | $331,307 | $86,888 | $244,419 |
| 2023 | $3,353 | $324,812 | $85,185 | $239,627 |
| 2022 | $3,479 | $318,444 | $83,515 | $234,929 |
| 2021 | $3,257 | $312,201 | $81,878 | $230,323 |
| 2020 | $3,231 | $309,001 | $81,039 | $227,962 |
| 2019 | $3,164 | $302,943 | $79,450 | $223,493 |
| 2018 | $3,115 | $297,004 | $77,893 | $219,111 |
| 2017 | $3,098 | $291,181 | $76,366 | $214,815 |
| 2016 | $3,097 | $285,472 | $74,869 | $210,603 |
| 2015 | $3,068 | $281,185 | $73,745 | $207,440 |
| 2014 | $2,867 | $275,678 | $72,301 | $203,377 |
Source: Public Records
Map
Nearby Homes
Your Personal Tour Guide
Ask me questions while you tour the home.