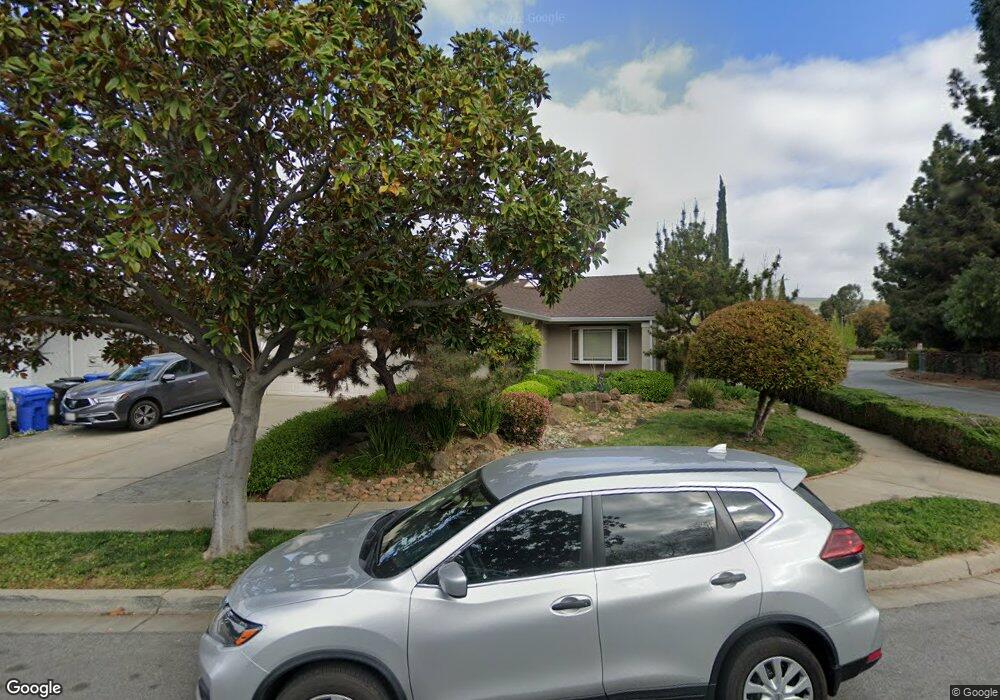
1267 Kruger Ave Fremont, CA 94536
Parkmont NeighborhoodEstimated Value: $1,439,808 - $1,639,000
3
Beds
2
Baths
1,471
Sq Ft
$1,050/Sq Ft
Est. Value
About This Home
This home is located at 1267 Kruger Ave, Fremont, CA 94536 and is currently estimated at $1,544,702, approximately $1,050 per square foot. 1267 Kruger Ave is a home located in Alameda County with nearby schools including Parkmont Elementary School, Centerville Junior High School, and Washington High School.
Ownership History
Date
Name
Owned For
Owner Type
Purchase Details
Closed on
May 21, 2019
Sold by
Sadhwani Rakesh and Jeswani Shaloo
Bought by
Sadhwani Rakesh and Jeswani Shaloo
Current Estimated Value
Purchase Details
Closed on
Nov 16, 2004
Sold by
Bozorg Chami Behzad and Bozorg Chami Behnaz
Bought by
Sadhwani Rakesh and Jeswani Shaloo
Home Financials for this Owner
Home Financials are based on the most recent Mortgage that was taken out on this home.
Original Mortgage
$506,400
Outstanding Balance
$230,924
Interest Rate
4.5%
Mortgage Type
Purchase Money Mortgage
Estimated Equity
$1,313,778
Purchase Details
Closed on
Jan 9, 1998
Sold by
Smith Guy S and Smith Christine M
Bought by
Farsi Behnaz and Bozorg Chami Behzad
Home Financials for this Owner
Home Financials are based on the most recent Mortgage that was taken out on this home.
Original Mortgage
$205,600
Interest Rate
7.14%
Create a Home Valuation Report for This Property
The Home Valuation Report is an in-depth analysis detailing your home's value as well as a comparison with similar homes in the area
Home Values in the Area
Average Home Value in this Area
Purchase History
| Date | Buyer | Sale Price | Title Company |
|---|---|---|---|
| Sadhwani Rakesh | -- | None Available | |
| Sadhwani Rakesh | $645,000 | -- | |
| Farsi Behnaz | $257,000 | North American Title Co |
Source: Public Records
Mortgage History
| Date | Status | Borrower | Loan Amount |
|---|---|---|---|
| Open | Sadhwani Rakesh | $506,400 | |
| Previous Owner | Farsi Behnaz | $205,600 | |
| Closed | Sadhwani Rakesh | $63,300 |
Source: Public Records
Tax History Compared to Growth
Tax History
| Year | Tax Paid | Tax Assessment Tax Assessment Total Assessment is a certain percentage of the fair market value that is determined by local assessors to be the total taxable value of land and additions on the property. | Land | Improvement |
|---|---|---|---|---|
| 2025 | $10,726 | $891,987 | $269,696 | $629,291 |
| 2024 | $10,726 | $874,366 | $264,410 | $616,956 |
| 2023 | $10,439 | $864,087 | $259,226 | $604,861 |
| 2022 | $10,305 | $840,148 | $254,144 | $593,004 |
| 2021 | $10,051 | $823,540 | $249,162 | $581,378 |
| 2020 | $10,085 | $822,026 | $246,608 | $575,418 |
| 2019 | $9,969 | $805,914 | $241,774 | $564,140 |
| 2018 | $9,774 | $790,117 | $237,035 | $553,082 |
| 2017 | $9,529 | $774,631 | $232,389 | $542,242 |
| 2016 | $9,368 | $759,448 | $227,834 | $531,614 |
| 2015 | $9,244 | $748,044 | $224,413 | $523,631 |
| 2014 | $9,085 | $733,397 | $220,019 | $513,378 |
Source: Public Records
Map
Nearby Homes
- 1145 Bennett Ct
- 1554 Gilbert Place
- 38131 Acacia St
- 38605 Vancouver Common
- 38538 Tyson Ln
- 38101 Cambridge Ct
- 37811 Fernwood Ct
- 38780 Tyson Ln Unit 305C
- 38780 Tyson Ln Unit 205C
- 38623 Cherry Ln Unit 148
- 38623 Cherry Ln Unit 175
- 38623 Cherry Ln Unit 201
- 38623 Cherry Ln Unit 203
- 38627 Cherry Ln Unit 71
- 38784 Huntington Cir
- 38455 Bronson St Unit 325
- 2755 Country Dr Unit 311
- 38697 Huntington Cir
- 1225 Koi Terrace
- 957 Huntington Common
- 1279 Kruger Ave
- 1368 Hardy Place
- 1291 Kruger Ave
- 1390 Hardy Place
- 1410 Hardy Place
- 1260 Kruger Ave
- 1303 Kruger Ave
- 1272 Kruger Ave
- 1284 Kruger Ave
- 1426 Hardy Place
- 1292 Kruger Ave
- 1251 Peralta Blvd
- 1315 Kruger Ave
- 1304 Kruger Ave
- 1440 Hardy Place
- 1361 Peralta Blvd
- 1361 Hardy Place
- 1377 Hardy Place
- 1391 Hardy Place
- 1377 Peralta Blvd