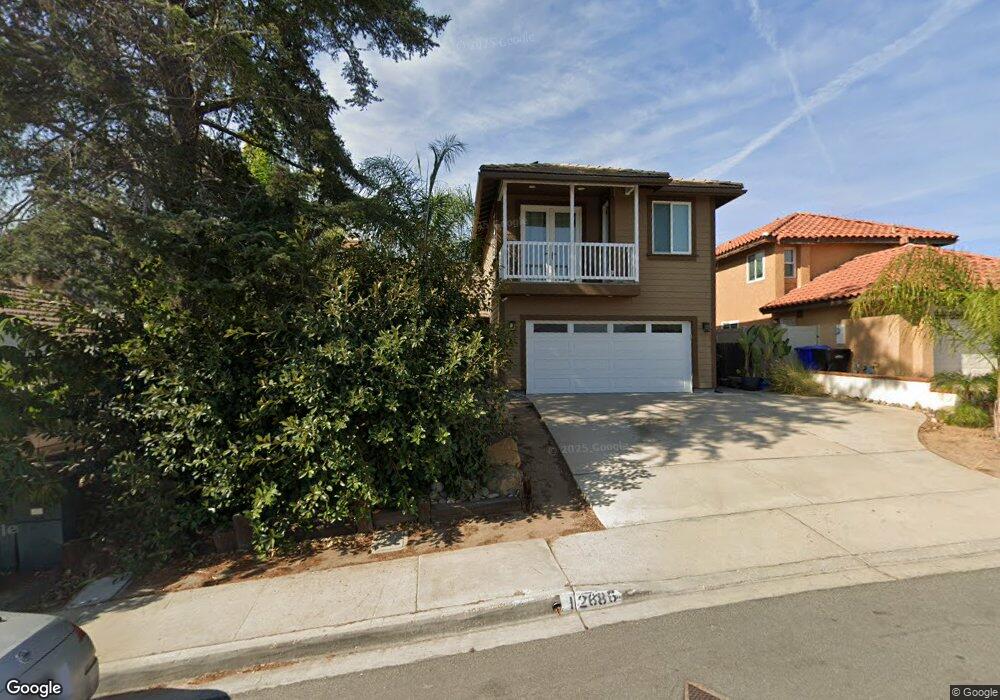
12686 Ragweed St San Diego, CA 92129
Rancho Peñasquitos NeighborhoodEstimated Value: $1,184,000 - $1,763,218
3
Beds
2
Baths
1,455
Sq Ft
$1,015/Sq Ft
Est. Value
About This Home
This home is located at 12686 Ragweed St, San Diego, CA 92129 and is currently estimated at $1,476,555, approximately $1,014 per square foot. 12686 Ragweed St is a home located in San Diego County with nearby schools including Canyon View Elementary School, Mesa Verde Middle School, and Westview High School.
Ownership History
Date
Name
Owned For
Owner Type
Purchase Details
Closed on
Feb 15, 2023
Sold by
Stropky Richard A
Bought by
2006 Stropky Family Trust
Current Estimated Value
Purchase Details
Closed on
May 18, 2011
Sold by
Powell Jacqueline
Bought by
Stropky Richard A and Stropky Kirsten L
Home Financials for this Owner
Home Financials are based on the most recent Mortgage that was taken out on this home.
Original Mortgage
$385,668
Interest Rate
4.37%
Mortgage Type
FHA
Purchase Details
Closed on
Jul 7, 2004
Sold by
Dorsett Jeffrey L and Dorsett Terry L
Bought by
Powell Jacqueline
Home Financials for this Owner
Home Financials are based on the most recent Mortgage that was taken out on this home.
Original Mortgage
$504,000
Interest Rate
6.27%
Mortgage Type
Stand Alone First
Purchase Details
Closed on
Aug 12, 1985
Create a Home Valuation Report for This Property
The Home Valuation Report is an in-depth analysis detailing your home's value as well as a comparison with similar homes in the area
Home Values in the Area
Average Home Value in this Area
Purchase History
| Date | Buyer | Sale Price | Title Company |
|---|---|---|---|
| 2006 Stropky Family Trust | -- | -- | |
| Stropky Richard A | $396,000 | Ticor Title Company Of Calif | |
| Powell Jacqueline | $630,000 | Fidelity National Title Co | |
| -- | $127,000 | -- |
Source: Public Records
Mortgage History
| Date | Status | Borrower | Loan Amount |
|---|---|---|---|
| Previous Owner | Stropky Richard A | $385,668 | |
| Previous Owner | Powell Jacqueline | $504,000 |
Source: Public Records
Tax History Compared to Growth
Tax History
| Year | Tax Paid | Tax Assessment Tax Assessment Total Assessment is a certain percentage of the fair market value that is determined by local assessors to be the total taxable value of land and additions on the property. | Land | Improvement |
|---|---|---|---|---|
| 2025 | $8,057 | $720,209 | $281,852 | $438,357 |
| 2024 | $8,057 | $706,088 | $276,326 | $429,762 |
| 2023 | $7,888 | $692,244 | $270,908 | $421,336 |
| 2022 | $7,764 | $678,672 | $265,597 | $413,075 |
| 2021 | $7,664 | $665,366 | $260,390 | $404,976 |
| 2020 | $7,554 | $658,545 | $257,721 | $400,824 |
| 2019 | $6,682 | $587,057 | $252,668 | $334,389 |
| 2018 | $6,479 | $575,547 | $247,714 | $327,833 |
| 2017 | $4,883 | $436,811 | $242,857 | $193,954 |
| 2016 | $4,783 | $428,247 | $238,096 | $190,151 |
| 2015 | $4,699 | $421,815 | $234,520 | $187,295 |
| 2014 | $4,588 | $413,554 | $229,927 | $183,627 |
Source: Public Records
Map
Nearby Homes
- 9012 Buckwheat St
- 9068 Buckwheat St
- 12776 Isocoma St Unit 4
- 12537 Ginger Snap Ct
- 8695 Rideabout Ln
- 12573 Brickellia St
- 8754 Park Run Rd
- 8672 Creekwood Ln
- 12465 Pathos Ln
- 12518 Darkwood Rd
- 12485 Picrus St
- 12880 War Horse St
- 12740 Prairie Dog Ave
- 13146 Thunderhead St
- 9446 Pipilo St
- 9342 Twin Trails Dr Unit 303
- 9302 Twin Trails Dr Unit 204
- 9525 Vervain St
- 11598 Alkaid Dr
- 9368 Babauta Rd Unit 93
- 12690 Ragweed St
- 12682 Ragweed St
- 12678 Ragweed St
- 12674 Ragweed St
- 12693 Ragweed St
- 12683 Ragweed St
- 12670 Ragweed St
- 12673 Ragweed St
- 12826 Texana St
- 12832 Texana St
- 12666 Ragweed St
- 12838 Texana St
- 12820 Texana St
- 12844 Texana St
- 12814 Texana St
- 12850 Texana St
- 12662 Ragweed St
- 9020 Buckwheat St
- 12808 Texana St
- 12856 Texana St