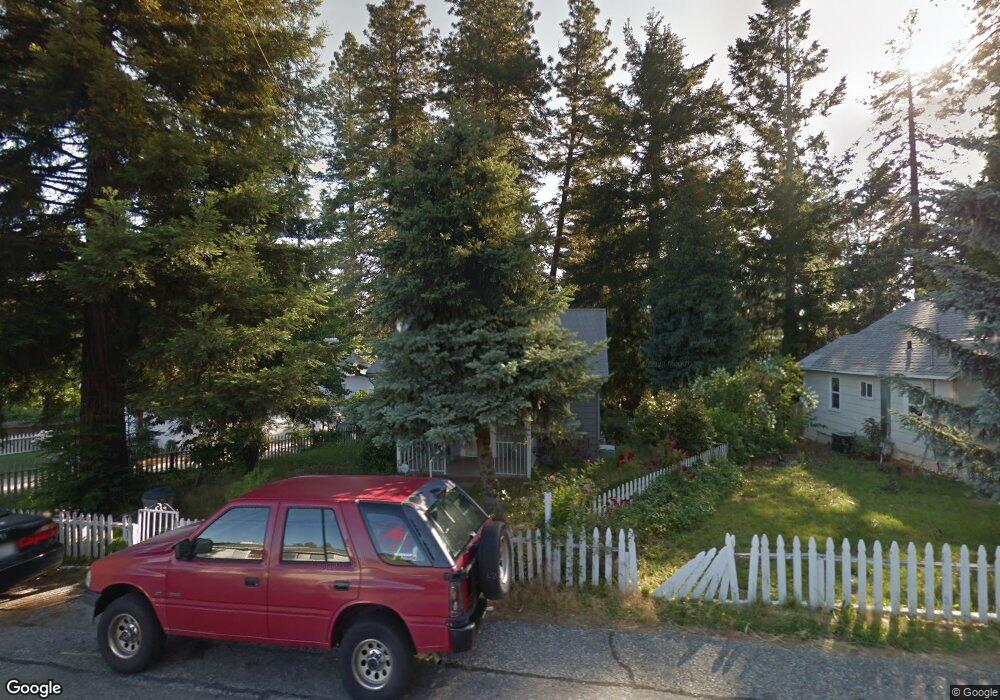
127 Hocking Ave Grass Valley, CA 95945
Estimated Value: $274,000 - $326,000
2
Beds
1
Bath
698
Sq Ft
$437/Sq Ft
Est. Value
About This Home
This home is located at 127 Hocking Ave, Grass Valley, CA 95945 and is currently estimated at $305,006, approximately $436 per square foot. 127 Hocking Ave is a home located in Nevada County with nearby schools including Bell Hill Academy, Margaret G. Scotten Elementary School, and Lyman Gilmore Middle School.
Ownership History
Date
Name
Owned For
Owner Type
Purchase Details
Closed on
Mar 7, 2022
Sold by
Willoughby and Wendy
Bought by
Willoughby 2022 Living Trust
Current Estimated Value
Purchase Details
Closed on
Apr 20, 2021
Sold by
Smith Ron and Smith Sandra L
Bought by
Willoughby Matthew and Willoughby Wendy
Home Financials for this Owner
Home Financials are based on the most recent Mortgage that was taken out on this home.
Original Mortgage
$211,200
Interest Rate
3.05%
Mortgage Type
New Conventional
Purchase Details
Closed on
Apr 15, 2016
Sold by
Smith Ronald G and Smith Sandra L
Bought by
The Ronald & Sandra Smith Living Trust
Purchase Details
Closed on
Mar 14, 2005
Sold by
Depauli Barbara D and Depauli Matthew D
Bought by
Smith Ronald G and Smith Sandra L
Home Financials for this Owner
Home Financials are based on the most recent Mortgage that was taken out on this home.
Original Mortgage
$172,500
Interest Rate
5.61%
Mortgage Type
Purchase Money Mortgage
Create a Home Valuation Report for This Property
The Home Valuation Report is an in-depth analysis detailing your home's value as well as a comparison with similar homes in the area
Home Values in the Area
Average Home Value in this Area
Purchase History
| Date | Buyer | Sale Price | Title Company |
|---|---|---|---|
| Willoughby 2022 Living Trust | -- | Hendricks Mcfarlane Pc | |
| Willoughby Matthew | $264,000 | First American Title Company | |
| The Ronald & Sandra Smith Living Trust | -- | None Available | |
| Smith Ronald G | $230,000 | Fidelity National Title Co |
Source: Public Records
Mortgage History
| Date | Status | Borrower | Loan Amount |
|---|---|---|---|
| Previous Owner | Willoughby Matthew | $211,200 | |
| Previous Owner | Smith Ronald G | $172,500 |
Source: Public Records
Tax History
| Year | Tax Paid | Tax Assessment Tax Assessment Total Assessment is a certain percentage of the fair market value that is determined by local assessors to be the total taxable value of land and additions on the property. | Land | Improvement |
|---|---|---|---|---|
| 2025 | $2,852 | $263,874 | $99,960 | $163,914 |
| 2024 | $2,838 | $258,700 | $98,000 | $160,700 |
| 2023 | $2,838 | $258,700 | $98,000 | $160,700 |
| 2022 | $2,980 | $269,280 | $102,000 | $167,280 |
| 2021 | $3,242 | $296,171 | $212,473 | $83,698 |
| 2020 | $3,144 | $284,300 | $85,700 | $198,600 |
| 2019 | $3,015 | $278,700 | $84,000 | $194,700 |
| 2018 | $2,919 | $265,400 | $80,000 | $185,400 |
| 2017 | $2,589 | $239,700 | $172,000 | $67,700 |
| 2016 | $2,314 | $217,500 | $156,000 | $61,500 |
| 2015 | $2,229 | $209,100 | $150,000 | $59,100 |
| 2014 | $2,229 | $195,200 | $140,000 | $55,200 |
Source: Public Records
Map
Nearby Homes
- 265 Cornwall Ave Unit 2
- 245 Cornwall Ave
- 240 Cornwall Ave
- 526 Mill St
- 526 Mill St Unit 1
- 0 Pleasant St Unit 226035306
- 517 Mill St
- 348 Marshall St
- 322 Mill St
- 17 Juan Way
- 618 Walsh St
- 410-362 Marshall St
- 518 Walsh St
- 30 Candy Ln
- 143 Scotia Pines Cir
- 46 Wendy Cir
- 65 Primrose Ln
- 650 Le Duc St
- 112 Ben Taylor Crossing
- 626 S Auburn St
Your Personal Tour Guide
Ask me questions while you tour the home.