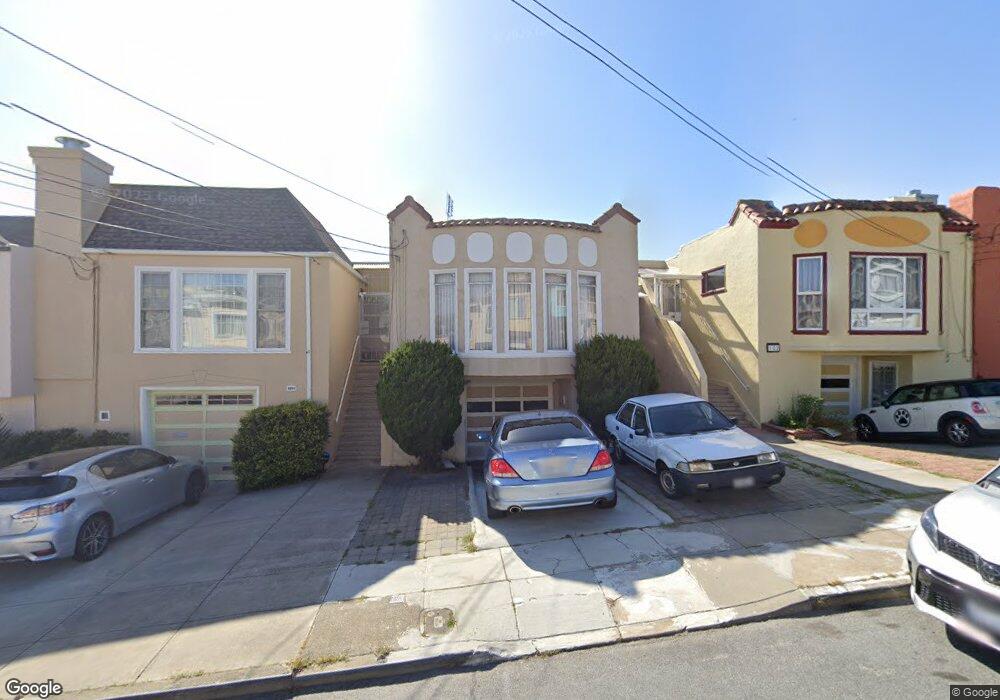
127 Monticello St San Francisco, CA 94132
Ingleside Heights NeighborhoodEstimated Value: $996,011 - $1,106,000
2
Beds
1
Bath
1,170
Sq Ft
$900/Sq Ft
Est. Value
About This Home
This home is located at 127 Monticello St, San Francisco, CA 94132 and is currently estimated at $1,052,753, approximately $899 per square foot. 127 Monticello St is a home located in San Francisco County with nearby schools including Ortega (Jose) Elementary School, Aptos Middle School, and Krouzian-Zekarian-Vasbouragan Armenian School.
Ownership History
Date
Name
Owned For
Owner Type
Purchase Details
Closed on
Oct 12, 1995
Sold by
Fong Jerome and Fong Carol L
Bought by
Yap Jimmy Teh and Barlin Andrew
Current Estimated Value
Home Financials for this Owner
Home Financials are based on the most recent Mortgage that was taken out on this home.
Original Mortgage
$136,000
Outstanding Balance
$973
Interest Rate
7.8%
Estimated Equity
$1,051,780
Create a Home Valuation Report for This Property
The Home Valuation Report is an in-depth analysis detailing your home's value as well as a comparison with similar homes in the area
Home Values in the Area
Average Home Value in this Area
Purchase History
| Date | Buyer | Sale Price | Title Company |
|---|---|---|---|
| Yap Jimmy Teh | $211,500 | Fidelity National Title Ins |
Source: Public Records
Mortgage History
| Date | Status | Borrower | Loan Amount |
|---|---|---|---|
| Open | Yap Jimmy Teh | $136,000 |
Source: Public Records
Tax History Compared to Growth
Tax History
| Year | Tax Paid | Tax Assessment Tax Assessment Total Assessment is a certain percentage of the fair market value that is determined by local assessors to be the total taxable value of land and additions on the property. | Land | Improvement |
|---|---|---|---|---|
| 2025 | $4,064 | $351,329 | $207,645 | $143,684 |
| 2024 | $4,064 | $344,441 | $203,574 | $140,867 |
| 2023 | $4,005 | $337,688 | $199,583 | $138,105 |
| 2022 | $3,934 | $331,068 | $195,670 | $135,398 |
| 2021 | $3,866 | $324,578 | $191,834 | $132,744 |
| 2020 | $3,877 | $321,250 | $189,867 | $131,383 |
| 2019 | $3,745 | $314,952 | $186,145 | $128,807 |
| 2018 | $3,621 | $308,778 | $182,496 | $126,282 |
| 2017 | $3,578 | $302,724 | $178,918 | $123,806 |
| 2016 | $3,496 | $296,789 | $175,410 | $121,379 |
| 2015 | $3,720 | $292,332 | $172,776 | $119,556 |
| 2014 | $3,362 | $286,607 | $169,392 | $117,215 |
Source: Public Records
Map
Nearby Homes
- 131 Beverly St
- 230 Ralston St
- 621 Shields St
- 119 Vernon St
- 118 Summit Way
- 73 Summit Way
- 531 Arch St
- 424 Garfield St
- 532 Ramsell St
- 233 Sargent St
- 475 Head St
- 150 Chester Ave
- 114 Saint Charles Ave
- 442 Bright St
- 20 Sargent St
- 274 Montana St
- 8100 Oceanview Terrace Unit 112
- 8400 Oceanview Terrace Unit 305
- 914 Capitol Ave
- 337 Jules Ave
- 131 Monticello St
- 123 Monticello St
- 135 Monticello St
- 119 Monticello St
- 139 Monticello St
- 115 Monticello St
- 143 Monticello St
- 111 Monticello St
- 26 Beverly St
- 30 Beverly St
- 22 Beverly St
- 18 Beverly St Unit 20
- 34 Beverly St
- 918 Sargent St
- 147 Monticello St
- 38 Beverly St
- 107 Monticello St
- 924 Sargent St Unit 926
- 42 Beverly St
- 151 Monticello St