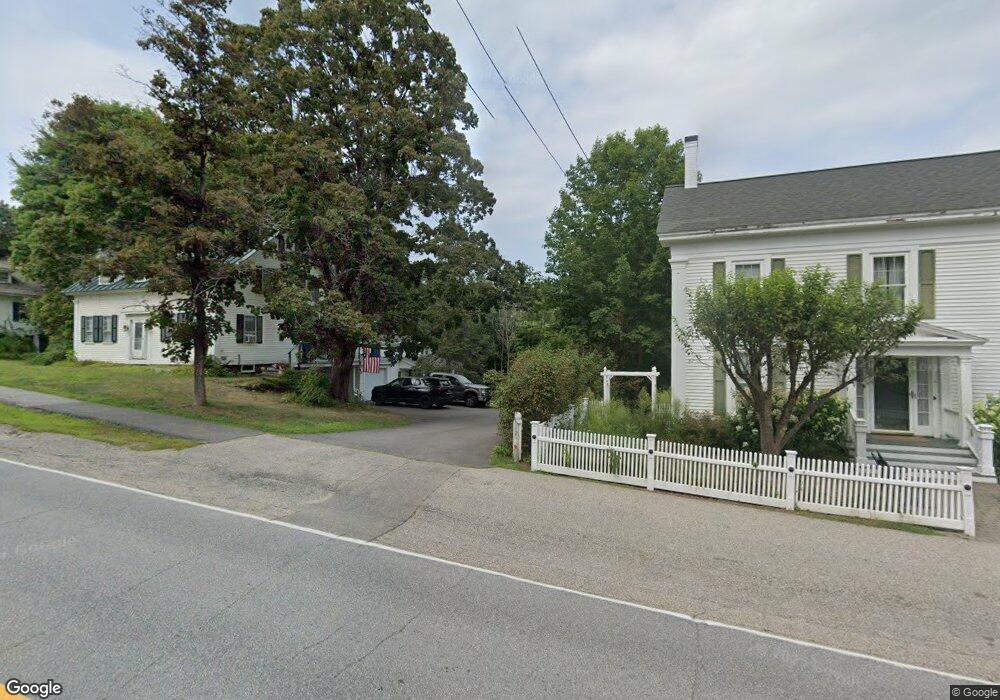
127 N Main St Wolfeboro, NH 03894
Estimated Value: $538,465 - $691,000
2
Beds
2
Baths
2,021
Sq Ft
$296/Sq Ft
Est. Value
About This Home
This home is located at 127 N Main St, Wolfeboro, NH 03894 and is currently estimated at $597,616, approximately $295 per square foot. 127 N Main St is a home with nearby schools including Carpenter Elementary School, Crescent Lake School, and Kingswood Regional Middle School.
Ownership History
Date
Name
Owned For
Owner Type
Purchase Details
Closed on
Jul 1, 2021
Sold by
Skelley Douglas C and Skelley Margot
Bought by
127 North Main St T
Current Estimated Value
Purchase Details
Closed on
Jan 10, 2018
Sold by
Skelley Margot
Bought by
Skelley Douglas C and Skelley Margot
Home Financials for this Owner
Home Financials are based on the most recent Mortgage that was taken out on this home.
Original Mortgage
$120,000
Interest Rate
3.9%
Mortgage Type
Unknown
Purchase Details
Closed on
Jun 14, 2005
Sold by
Coelho Russell A and Coelho Sally A
Bought by
Varney Margot
Home Financials for this Owner
Home Financials are based on the most recent Mortgage that was taken out on this home.
Original Mortgage
$150,000
Interest Rate
5.79%
Mortgage Type
Purchase Money Mortgage
Create a Home Valuation Report for This Property
The Home Valuation Report is an in-depth analysis detailing your home's value as well as a comparison with similar homes in the area
Home Values in the Area
Average Home Value in this Area
Purchase History
| Date | Buyer | Sale Price | Title Company |
|---|---|---|---|
| 127 North Main St T | -- | None Available | |
| Skelley Douglas C | -- | -- | |
| Varney Margot | $255,000 | -- |
Source: Public Records
Mortgage History
| Date | Status | Borrower | Loan Amount |
|---|---|---|---|
| Previous Owner | Skelley Douglas C | $120,000 | |
| Previous Owner | Varney Margot | $150,000 |
Source: Public Records
Tax History Compared to Growth
Tax History
| Year | Tax Paid | Tax Assessment Tax Assessment Total Assessment is a certain percentage of the fair market value that is determined by local assessors to be the total taxable value of land and additions on the property. | Land | Improvement |
|---|---|---|---|---|
| 2024 | $4,310 | $271,100 | $107,700 | $163,400 |
| 2023 | $3,982 | $271,100 | $107,700 | $163,400 |
| 2022 | $3,584 | $271,100 | $107,700 | $163,400 |
| 2021 | $3,706 | $271,100 | $107,700 | $163,400 |
| 2020 | $3,527 | $271,100 | $107,700 | $163,400 |
| 2019 | $3,597 | $227,100 | $87,400 | $139,700 |
| 2018 | $3,588 | $227,100 | $87,400 | $139,700 |
| 2017 | $3,460 | $231,000 | $87,400 | $143,600 |
| 2016 | $3,380 | $231,000 | $87,400 | $143,600 |
| 2015 | $3,167 | $227,000 | $87,400 | $139,600 |
| 2014 | $2,657 | $204,200 | $78,000 | $126,200 |
| 2013 | $2,620 | $204,200 | $78,000 | $126,200 |
Source: Public Records
Map
Nearby Homes
- 68 Railroad Ave Unit 3
- 222 N Main St
- 61 Lehner St
- 68 Center St
- 8 Pine Hill Rd
- 108 Center St
- 180 Sewall Rd
- 127 Forest Rd
- 195 Sewall Rd
- 79 S Main St
- 21 Goodrich Rd
- 172 Center St
- 79 River St
- 163 Clark Rd
- 88 Ambrose Way
- 208 Forest Rd
- 185 Ambrose Way
- 165 Ambrose Way
- 3 Cedar Dr
- 00 Trask Mountain (Lot 3) Rd Unit 3