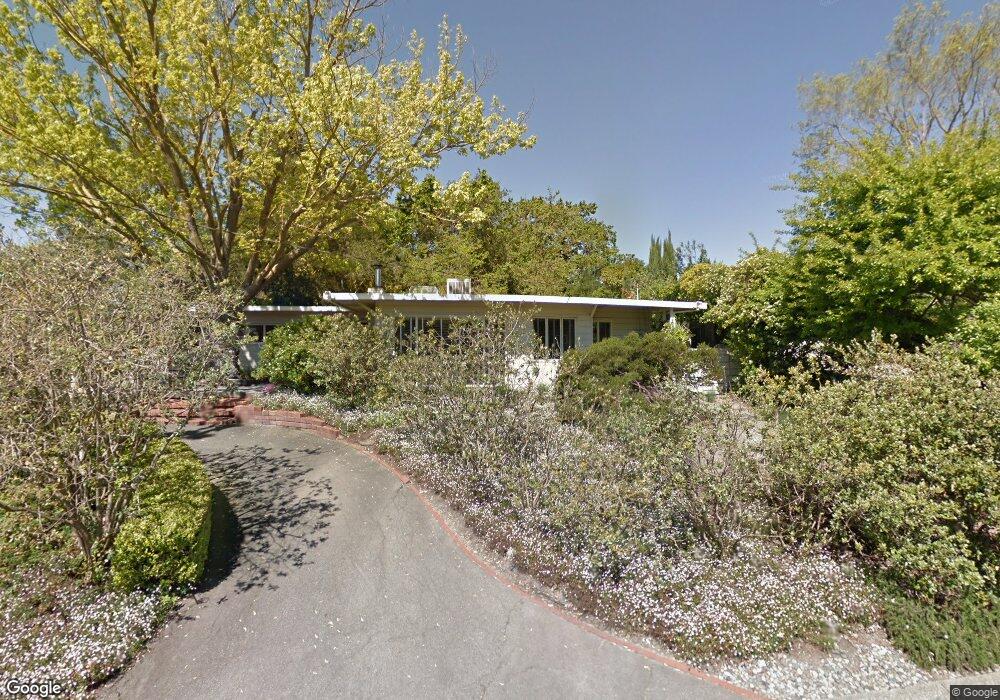
1271 Sunset Loop Lafayette, CA 94549
Peardale Estates NeighborhoodEstimated Value: $1,178,184 - $1,269,000
3
Beds
1
Bath
1,376
Sq Ft
$877/Sq Ft
Est. Value
About This Home
This home is located at 1271 Sunset Loop, Lafayette, CA 94549 and is currently estimated at $1,206,296, approximately $876 per square foot. 1271 Sunset Loop is a home located in Contra Costa County with nearby schools including Burton Valley Elementary School, M.H. Stanley Middle School, and Acalanes High School.
Ownership History
Date
Name
Owned For
Owner Type
Purchase Details
Closed on
Mar 7, 2003
Sold by
Hay Donald Roger and Hay Mary H
Bought by
Hay Donald and Hay Mary
Current Estimated Value
Home Financials for this Owner
Home Financials are based on the most recent Mortgage that was taken out on this home.
Original Mortgage
$285,000
Interest Rate
5.83%
Mortgage Type
Purchase Money Mortgage
Purchase Details
Closed on
Sep 3, 1998
Sold by
Michael Colbert John
Bought by
Hay Donald Roger and Hay Mary H
Home Financials for this Owner
Home Financials are based on the most recent Mortgage that was taken out on this home.
Original Mortgage
$293,550
Interest Rate
6.92%
Mortgage Type
Purchase Money Mortgage
Purchase Details
Closed on
Mar 9, 1996
Sold by
Colbert John Michael
Bought by
Colbert John M
Create a Home Valuation Report for This Property
The Home Valuation Report is an in-depth analysis detailing your home's value as well as a comparison with similar homes in the area
Home Values in the Area
Average Home Value in this Area
Purchase History
| Date | Buyer | Sale Price | Title Company |
|---|---|---|---|
| Hay Donald | -- | Financial Title | |
| Hay Donald Roger | $309,000 | First American Title Guarant | |
| Colbert John M | -- | -- |
Source: Public Records
Mortgage History
| Date | Status | Borrower | Loan Amount |
|---|---|---|---|
| Closed | Hay Donald | $285,000 | |
| Closed | Hay Donald Roger | $293,550 |
Source: Public Records
Tax History
| Year | Tax Paid | Tax Assessment Tax Assessment Total Assessment is a certain percentage of the fair market value that is determined by local assessors to be the total taxable value of land and additions on the property. | Land | Improvement |
|---|---|---|---|---|
| 2025 | $6,002 | $484,399 | $321,367 | $163,032 |
| 2024 | $7,197 | $474,902 | $315,066 | $159,836 |
| 2023 | $7,056 | $465,591 | $308,889 | $156,702 |
| 2022 | $6,944 | $456,463 | $302,833 | $153,630 |
| 2021 | $6,744 | $447,514 | $296,896 | $150,618 |
| 2019 | $6,351 | $434,242 | $288,091 | $146,151 |
| 2018 | $6,131 | $425,729 | $282,443 | $143,286 |
| 2017 | $6,026 | $417,382 | $276,905 | $140,477 |
| 2016 | $5,890 | $409,199 | $271,476 | $137,723 |
| 2015 | $5,724 | $403,054 | $267,399 | $135,655 |
| 2014 | $5,651 | $395,160 | $262,162 | $132,998 |
Source: Public Records
Map
Nearby Homes
- 1521 Sunset Loop
- 1315 El Curtola Blvd
- 12 Westminster Place
- 1356 El Curtola Blvd
- 70 Carolyn Ct
- 0 Gladys Ct
- 1210 Kendall Ct
- 1305 Boulevard Way Unit 306
- 2513 Lucy Ln Unit B
- 194 Hillcroft Way
- 1160 Dunsyre Dr
- 100 Hillcroft Way
- 130 Hillcroft Way
- 3279 Mt Diablo Ct Unit 20
- 3279 Mt Diablo Ct Unit 13
- 918 Anita Ct
- 3246 Judy Ln
- 43 Cuesta Way
- 1722 S Villa Way
- 1731 S Villa Way Unit 336
- 1261 Sunset Loop
- 1281 Sunset Loop
- 1452 Sunset Loop
- 1470 Sunset Loop
- 1442 Sunset Loop
- 1251 Sunset Loop
- 1291 Sunset Loop
- 1292 Sunset Loop
- 1298 Sunset Loop
- 1432 Sunset Loop
- 1282 Sunset Loop
- 1472 Sunset Loop
- 1298
- 1241 Sunset Loop
- 1301 Sunset Loop
- 1422 Sunset Loop
- 1272 Sunset Loop
- 24 Sweet Rd
- 1482 Sunset Loop
- 1251 El Curtola Blvd
Your Personal Tour Guide
Ask me questions while you tour the home.