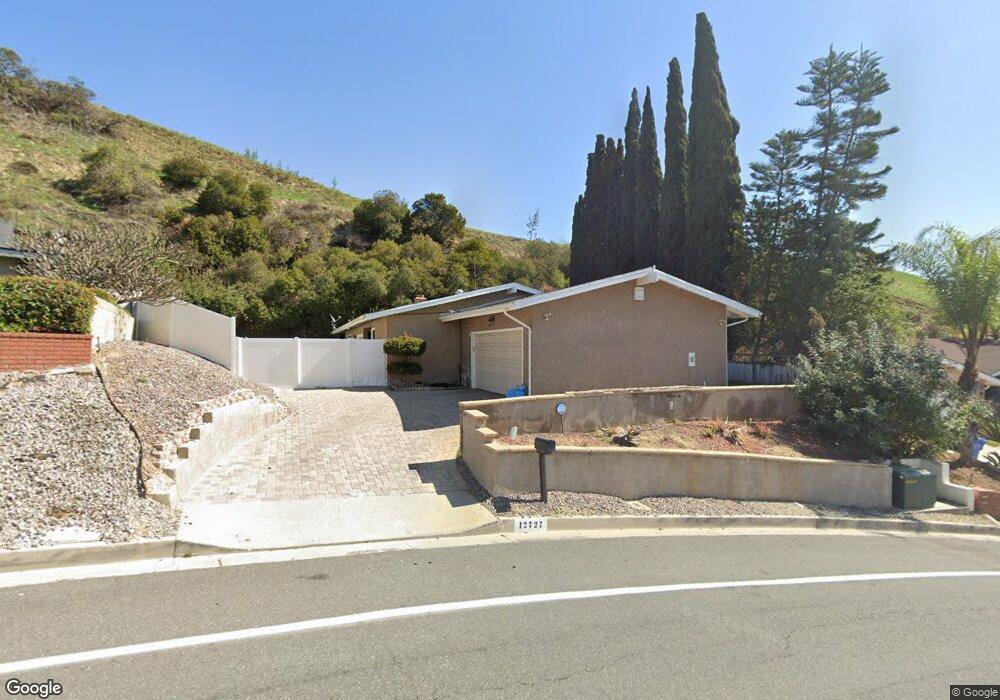
12727 Carinthia Dr Whittier, CA 90601
West Whittier NeighborhoodEstimated Value: $910,000 - $1,079,000
4
Beds
2
Baths
1,846
Sq Ft
$541/Sq Ft
Est. Value
About This Home
This home is located at 12727 Carinthia Dr, Whittier, CA 90601 and is currently estimated at $997,843, approximately $540 per square foot. 12727 Carinthia Dr is a home located in Los Angeles County with nearby schools including Lou Henry Hoover Elementary School, Walter F. Dexter Middle School, and Whittier High School.
Ownership History
Date
Name
Owned For
Owner Type
Purchase Details
Closed on
Jul 29, 2009
Sold by
Homesales Inc
Bought by
Manoukian Sevag and Manoukian Vicki
Current Estimated Value
Home Financials for this Owner
Home Financials are based on the most recent Mortgage that was taken out on this home.
Original Mortgage
$386,650
Interest Rate
5.18%
Mortgage Type
FHA
Purchase Details
Closed on
Aug 7, 2008
Sold by
Tibbs Scott A and Tibbs Natalie C
Bought by
Homesales Inc Of Delaware
Purchase Details
Closed on
Aug 30, 2001
Sold by
Bevli Gurcharan and Bevli Pammi
Bought by
Tibbs Scott A and Tibbs Natalie C
Home Financials for this Owner
Home Financials are based on the most recent Mortgage that was taken out on this home.
Original Mortgage
$233,000
Interest Rate
7.05%
Mortgage Type
Seller Take Back
Create a Home Valuation Report for This Property
The Home Valuation Report is an in-depth analysis detailing your home's value as well as a comparison with similar homes in the area
Home Values in the Area
Average Home Value in this Area
Purchase History
| Date | Buyer | Sale Price | Title Company |
|---|---|---|---|
| Manoukian Sevag | $400,000 | Lsi Title Company Ca | |
| Homesales Inc Of Delaware | $326,115 | Accommodation | |
| Tibbs Scott A | $308,000 | First American Title Co |
Source: Public Records
Mortgage History
| Date | Status | Borrower | Loan Amount |
|---|---|---|---|
| Previous Owner | Manoukian Sevag | $386,650 | |
| Previous Owner | Tibbs Scott A | $233,000 | |
| Closed | Tibbs Scott A | $50,000 |
Source: Public Records
Tax History
| Year | Tax Paid | Tax Assessment Tax Assessment Total Assessment is a certain percentage of the fair market value that is determined by local assessors to be the total taxable value of land and additions on the property. | Land | Improvement |
|---|---|---|---|---|
| 2025 | $6,858 | $557,274 | $347,223 | $210,051 |
| 2024 | $6,858 | $546,348 | $340,415 | $205,933 |
| 2023 | $6,694 | $535,637 | $333,741 | $201,896 |
| 2022 | $6,500 | $525,136 | $327,198 | $197,938 |
| 2021 | $6,358 | $514,840 | $320,783 | $194,057 |
| 2019 | $6,327 | $499,571 | $311,269 | $188,302 |
| 2018 | $6,140 | $489,776 | $305,166 | $184,610 |
| 2016 | $5,610 | $436,158 | $293,317 | $142,841 |
| 2015 | $5,559 | $429,608 | $288,912 | $140,696 |
| 2014 | $5,464 | $421,193 | $283,253 | $137,940 |
Source: Public Records
Map
Nearby Homes
- 5522 Greenleaf Ave
- 12530 Carinthia Dr
- 5628 Panorama Dr
- 12423 Beverly Dr
- 12408 Carinthia Dr
- 5827 Washington Ave
- 4807 Cinco View Dr
- 11835 Pocasset Dr
- 5840 Citrus Ave
- 11908 Nixon Ln
- 13570 Turnbull Canyon Rd
- 11422 Ridgegate Dr
- 6233 Haviland Ave
- 11506 Sierra Sky Dr
- 12708 Hadley St
- 13521 Terrace Place
- 4310 Mountain Shadows Dr
- 5205 Tierra Bonita Dr
- 5315 Bihr Ct
- 12618 Bailey St
- 12721 Carinthia Dr
- 12733 Carinthia Dr
- 12720 Carinthia Dr
- 12717 Carinthia Dr
- 12741 Carinthia Dr
- 12736 Carinthia Dr
- 12711 Carinthia Dr
- 12749 Carinthia Dr
- 12744 Carinthia Dr
- 12704 Carinthia Dr
- 12703 Carinthia Dr
- 5442 Brookmead Dr
- 5503 Greenleaf Ave
- 5508 Greenleaf Ave
- 12651 Carinthia Dr
- 5450 Brookmead Dr
- 5511 Greenleaf Ave
- 12646 Carinthia Dr
- 5514 Greenleaf Ave
- 5433 Brookmead Dr
Your Personal Tour Guide
Ask me questions while you tour the home.