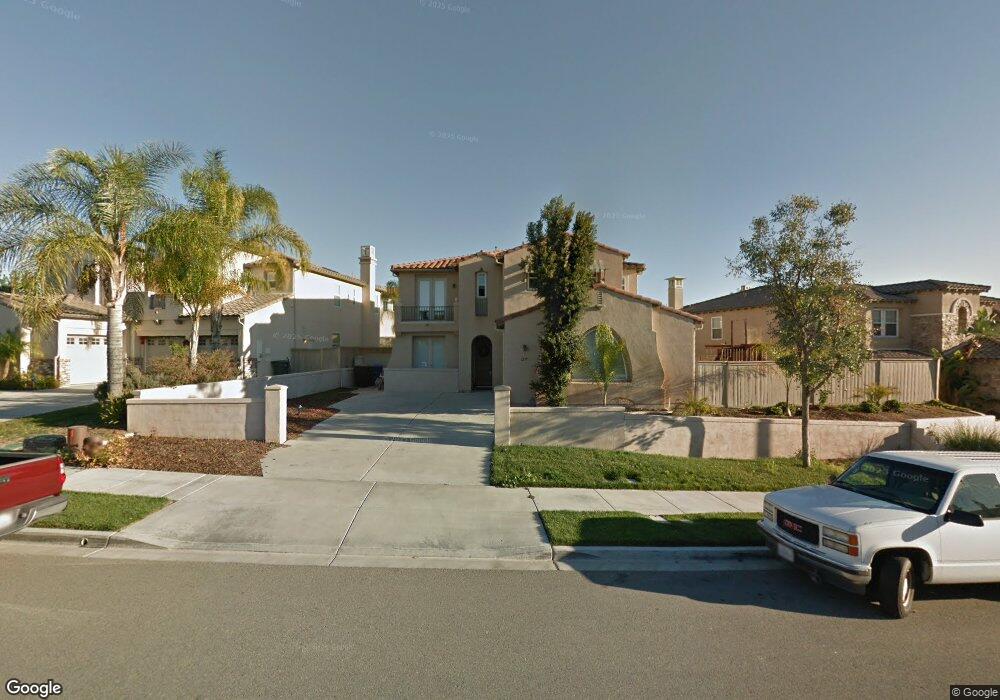
1275 Blue Sage Way Chula Vista, CA 91915
Eastlake NeighborhoodEstimated Value: $1,245,000 - $1,385,000
3
Beds
3
Baths
3,381
Sq Ft
$386/Sq Ft
Est. Value
About This Home
This home is located at 1275 Blue Sage Way, Chula Vista, CA 91915 and is currently estimated at $1,304,531, approximately $385 per square foot. 1275 Blue Sage Way is a home located in San Diego County with nearby schools including Salt Creek Elementary School, Eastlake Middle School, and Eastlake High School.
Ownership History
Date
Name
Owned For
Owner Type
Purchase Details
Closed on
Aug 18, 2018
Sold by
Escobedo Deborah Sabrina
Bought by
Deocampo Erika N and Escobedo Deborah S
Current Estimated Value
Purchase Details
Closed on
Aug 24, 2015
Sold by
Kc Assets Llc
Bought by
Escobedo Deborah Sabrina
Home Financials for this Owner
Home Financials are based on the most recent Mortgage that was taken out on this home.
Original Mortgage
$456,000
Outstanding Balance
$356,555
Interest Rate
3.86%
Mortgage Type
New Conventional
Estimated Equity
$947,976
Purchase Details
Closed on
Jan 17, 2015
Sold by
Gonzalez Saul Venegas and Gonzalez Cynthia Monreal
Bought by
Kc Assets Llc
Purchase Details
Closed on
Mar 4, 2005
Sold by
Cornerstone Gdci Chula Vista Lp
Bought by
Gonzalez Saul Venegas and Gonzalez Cynthia Monreal
Home Financials for this Owner
Home Financials are based on the most recent Mortgage that was taken out on this home.
Original Mortgage
$650,000
Interest Rate
6.35%
Mortgage Type
Unknown
Create a Home Valuation Report for This Property
The Home Valuation Report is an in-depth analysis detailing your home's value as well as a comparison with similar homes in the area
Home Values in the Area
Average Home Value in this Area
Purchase History
| Date | Buyer | Sale Price | Title Company |
|---|---|---|---|
| Deocampo Erika N | -- | None Available | |
| Escobedo Deborah Sabrina | $570,000 | Title365 | |
| Kc Assets Llc | $513,000 | Title365 | |
| Gonzalez Saul Venegas | $822,000 | First American Title |
Source: Public Records
Mortgage History
| Date | Status | Borrower | Loan Amount |
|---|---|---|---|
| Open | Escobedo Deborah Sabrina | $456,000 | |
| Previous Owner | Gonzalez Saul Venegas | $650,000 |
Source: Public Records
Tax History Compared to Growth
Tax History
| Year | Tax Paid | Tax Assessment Tax Assessment Total Assessment is a certain percentage of the fair market value that is determined by local assessors to be the total taxable value of land and additions on the property. | Land | Improvement |
|---|---|---|---|---|
| 2025 | $10,515 | $674,755 | $317,135 | $357,620 |
| 2024 | $10,515 | $661,525 | $310,917 | $350,608 |
| 2023 | $10,515 | $648,555 | $304,821 | $343,734 |
| 2022 | $10,224 | $635,840 | $298,845 | $336,995 |
| 2021 | $10,017 | $623,374 | $292,986 | $330,388 |
| 2020 | $9,805 | $616,983 | $289,982 | $327,001 |
| 2019 | $9,581 | $604,887 | $284,297 | $320,590 |
| 2018 | $9,461 | $593,027 | $278,723 | $314,304 |
| 2017 | $9,367 | $581,400 | $273,258 | $308,142 |
| 2016 | $8,954 | $570,000 | $267,900 | $302,100 |
| 2015 | $9,647 | $600,000 | $282,000 | $318,000 |
| 2014 | -- | $550,000 | $259,000 | $291,000 |
Source: Public Records
Map
Nearby Homes
- 1328 N Paradise Ridge Way
- 2832 Echo Ridge Ct
- 2744 Rambling Vista Rd
- 2850 Palmetto Point Ct
- 2792 Rambling Vista Rd
- 2814 Rambling Vista Rd
- 1427 Marble Canyon Way
- 1436 Horn Canyon Ave
- 1461 Agate Creek Way
- 1277 Granite Springs Dr
- 2796 Bear Valley Rd
- 1505 Laurel Grove Dr Unit 3
- 2993 Weeping Willow Rd
- 2721 Castlehill Rd Unit 1
- 2816 Weeping Willow Rd
- 2754 Silver Medal Rd Unit 1
- 1512 Champion Ln Unit 4
- 1515 Crown Ln Unit 6
- 2710 Sparta Rd Unit 10
- 2840 Athens Rd Unit 10
- 1281 Blue Sage Way
- 1265 Blue Sage Way
- 1285 Blue Sage Way
- 1149 Old Janal Ranch Rd
- 1278 Blue Sage Way
- 1274 Blue Sage Way
- 1289 Blue Sage Way
- 1270 Blue Sage Way
- 1282 Blue Sage Way
- 1259 Blue Sage Way
- 1266 Blue Sage Way
- 1286 Blue Sage Way
- 1145 Old Janal Ranch Rd
- 1301 Echo Ridge Terrace
- 1293 Blue Sage Way
- 1290 Blue Sage Way
- 1305 Echo Ridge Terrace
- 1255 Blue Sage Way
- 1297 Blue Sage Way
- 1255 Silver Hawk Way