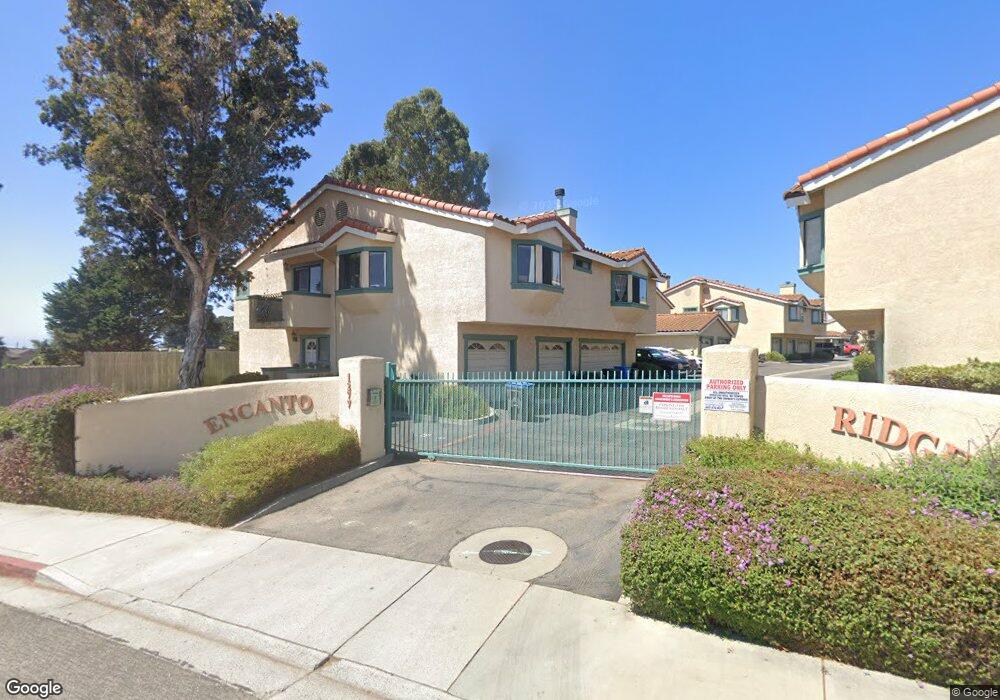
1277 Belridge St Unit 4B Oceano, CA 93445
Oceano NeighborhoodEstimated Value: $433,878 - $570,000
2
Beds
2
Baths
974
Sq Ft
$489/Sq Ft
Est. Value
About This Home
This home is located at 1277 Belridge St Unit 4B, Oceano, CA 93445 and is currently estimated at $476,720, approximately $489 per square foot. 1277 Belridge St Unit 4B is a home located in San Luis Obispo County with nearby schools including Oceano Elementary School, Judkins Middle School, and Arroyo Grande High School.
Ownership History
Date
Name
Owned For
Owner Type
Purchase Details
Closed on
Feb 22, 2016
Sold by
Semas Michael J and Semas Christine D
Bought by
Semas Michael J Semas An Christine D and Semas Christine D
Current Estimated Value
Purchase Details
Closed on
Sep 12, 2011
Sold by
Woolwine Diane Louise
Bought by
Semas Michael J and Semas Christine D
Home Financials for this Owner
Home Financials are based on the most recent Mortgage that was taken out on this home.
Original Mortgage
$110,000
Interest Rate
4.09%
Mortgage Type
New Conventional
Purchase Details
Closed on
Jul 18, 2007
Sold by
Grimes Jack E
Bought by
Grimes Jack E
Purchase Details
Closed on
Apr 9, 2001
Sold by
Grimes Jack E and Grimes Geal C
Bought by
Grimes Jack E and Grimes Geal C
Create a Home Valuation Report for This Property
The Home Valuation Report is an in-depth analysis detailing your home's value as well as a comparison with similar homes in the area
Home Values in the Area
Average Home Value in this Area
Purchase History
| Date | Buyer | Sale Price | Title Company |
|---|---|---|---|
| Semas Michael J Semas An Christine D | -- | None Available | |
| Semas Michael J | $160,000 | First American Title Company | |
| Grimes Jack E | -- | None Available | |
| Grimes Jack E | -- | -- |
Source: Public Records
Mortgage History
| Date | Status | Borrower | Loan Amount |
|---|---|---|---|
| Previous Owner | Semas Michael J | $110,000 |
Source: Public Records
Tax History Compared to Growth
Tax History
| Year | Tax Paid | Tax Assessment Tax Assessment Total Assessment is a certain percentage of the fair market value that is determined by local assessors to be the total taxable value of land and additions on the property. | Land | Improvement |
|---|---|---|---|---|
| 2025 | $2,387 | $200,956 | $100,478 | $100,478 |
| 2024 | $2,363 | $197,016 | $98,508 | $98,508 |
| 2023 | $2,363 | $193,154 | $96,577 | $96,577 |
| 2022 | $2,332 | $189,368 | $94,684 | $94,684 |
| 2021 | $2,328 | $185,656 | $92,828 | $92,828 |
| 2020 | $2,305 | $183,754 | $91,877 | $91,877 |
| 2019 | $2,290 | $180,152 | $90,076 | $90,076 |
| 2018 | $2,243 | $176,620 | $88,310 | $88,310 |
| 2017 | $2,187 | $173,158 | $86,579 | $86,579 |
| 2016 | $2,148 | $169,764 | $84,882 | $84,882 |
| 2015 | $1,795 | $167,214 | $83,607 | $83,607 |
| 2014 | $1,729 | $163,940 | $81,970 | $81,970 |
Source: Public Records
Map
Nearby Homes
- 1338 16th St
- 1610 16th St
- 1553 Palace Ave
- 0 Palace Ave Unit PI21196628
- 1659 Paso Robles St
- 1206 Capitola St
- 1207 Capitola St
- 1180 Marbella Ct
- 1515 Ocean St
- 155 Lynne St
- 1681 Ocean St
- 651 Pershing Dr
- 943 Huston St
- 948 Huston St
- 1626 Monterey Ave
- 978 Griffin St
- 2201 La Verne St
- 2120 Ocean St
- 1157 Norswing Dr
- 444 Pier Ave Unit 36
- 1277 Belridge St Unit 9
- 1277 Belridge St Unit 1
- 1277 Belridge St Unit 8
- 1277 Belridge St Unit C 3
- 1277 Belridge St
- 1277 Belridge St Unit 10A
- 1277 Belridge St Unit 9B
- 1277 Belridge St Unit 8B
- 1277 Belridge St Unit 8A
- 1277 Belridge St Unit 7C
- 1277 Belridge St Unit 7B
- 1277 Belridge St Unit 7A
- 1277 Belridge St Unit 6C
- 1277 Belridge St Unit 6B
- 1277 Belridge St Unit 6A
- 1277 Belridge St Unit 5C
- 1277 Belridge St Unit 5B
- 1277 Belridge St Unit 5A
- 1277 Belridge St Unit 4C
- 1277 Belridge St Unit 4A