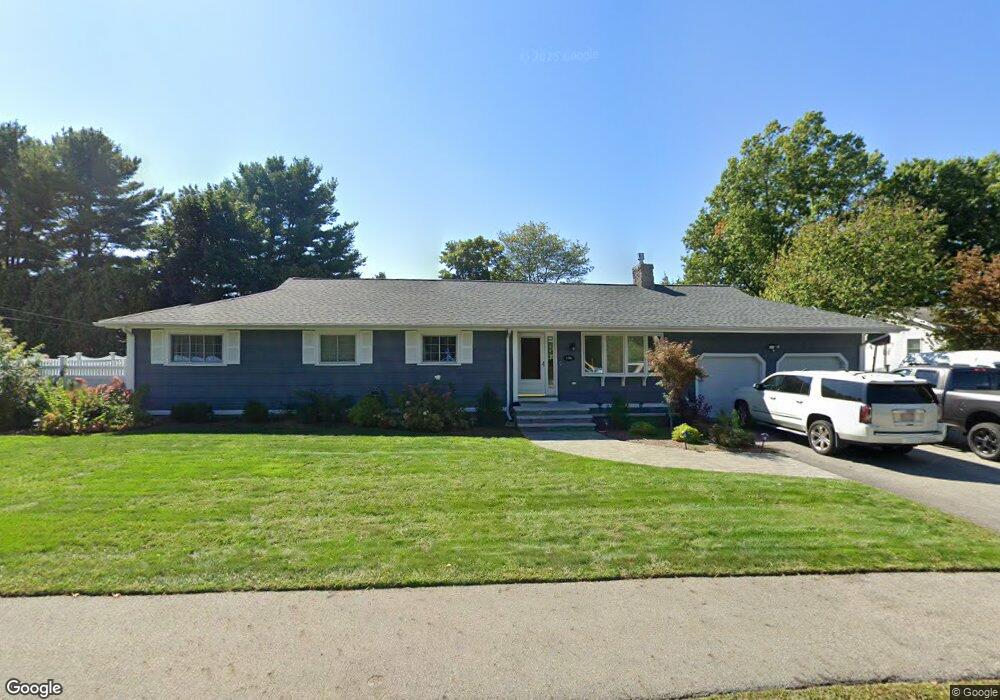
128 Lovejoy Rd Andover, MA 01810
West Andover NeighborhoodEstimated Value: $985,000 - $1,146,000
4
Beds
3
Baths
3,220
Sq Ft
$326/Sq Ft
Est. Value
About This Home
This home is located at 128 Lovejoy Rd, Andover, MA 01810 and is currently estimated at $1,050,013, approximately $326 per square foot. 128 Lovejoy Rd is a home located in Essex County with nearby schools including Henry C. Sanborn Elementary School, Andover West Middle School, and Andover High School.
Ownership History
Date
Name
Owned For
Owner Type
Purchase Details
Closed on
Oct 13, 2015
Sold by
Doran-Serafino Caitlin M
Bought by
C Doran Serafino Ret and Doran-Serafino
Current Estimated Value
Purchase Details
Closed on
Aug 31, 2015
Sold by
Eugena J Doran Jr Ret and Bernardin
Bought by
Doran-Serafino Caitlin M
Purchase Details
Closed on
Jan 14, 2014
Sold by
Eugene J Doran Jr Ret
Bought by
Doran-Serafino Caitlin M
Purchase Details
Closed on
Oct 14, 2011
Sold by
Leary David S and Leary Carol P
Bought by
Doran Eugene J
Home Financials for this Owner
Home Financials are based on the most recent Mortgage that was taken out on this home.
Original Mortgage
$356,250
Interest Rate
4.25%
Mortgage Type
Purchase Money Mortgage
Purchase Details
Closed on
Apr 30, 1996
Sold by
Robinson William
Bought by
Leary David S
Purchase Details
Closed on
Oct 30, 1991
Sold by
Coffey Thomas J
Bought by
Robinson William
Create a Home Valuation Report for This Property
The Home Valuation Report is an in-depth analysis detailing your home's value as well as a comparison with similar homes in the area
Home Values in the Area
Average Home Value in this Area
Purchase History
| Date | Buyer | Sale Price | Title Company |
|---|---|---|---|
| C Doran Serafino Ret | -- | -- | |
| C Doran Serafino Ret | -- | -- | |
| Doran-Serafino Caitlin M | -- | -- | |
| Doran-Serafino Caitlin M | -- | -- | |
| Doran-Serafino Caitlin M | -- | -- | |
| Doran-Serafino Caitlin M | -- | -- | |
| Doran Eugene J | $475,000 | -- | |
| Doran Eugene J | $475,000 | -- | |
| Leary David S | $217,000 | -- | |
| Leary David S | $217,000 | -- | |
| Robinson William | $190,000 | -- | |
| Robinson William | $190,000 | -- |
Source: Public Records
Mortgage History
| Date | Status | Borrower | Loan Amount |
|---|---|---|---|
| Previous Owner | Doran Eugene J | $356,250 |
Source: Public Records
Tax History Compared to Growth
Tax History
| Year | Tax Paid | Tax Assessment Tax Assessment Total Assessment is a certain percentage of the fair market value that is determined by local assessors to be the total taxable value of land and additions on the property. | Land | Improvement |
|---|---|---|---|---|
| 2024 | $8,588 | $666,800 | $362,400 | $304,400 |
| 2023 | $8,364 | $612,300 | $335,500 | $276,800 |
| 2022 | $7,674 | $525,600 | $284,200 | $241,400 |
| 2021 | $7,370 | $482,000 | $258,400 | $223,600 |
| 2020 | $7,079 | $471,600 | $252,100 | $219,500 |
| 2019 | $7,017 | $459,500 | $244,800 | $214,700 |
| 2018 | $6,728 | $430,200 | $230,800 | $199,400 |
| 2017 | $6,444 | $424,500 | $226,300 | $198,200 |
| 2016 | $6,285 | $424,100 | $226,300 | $197,800 |
| 2015 | $6,072 | $405,600 | $217,500 | $188,100 |
Source: Public Records
Map
Nearby Homes
- 4 Alonesos Way
- 15 Geneva Rd
- 14 Geneva Rd
- 41 W Parish Dr
- 33 Dascomb Rd
- 69 High Plain Rd
- 7 Stouffer Cir
- 17 Rose Glen Dr
- 4 Hazelwood Cir
- 22 Haggetts Pond Rd
- 23 Michael Way Unit 35
- 18 Bryan Ln Unit 18
- 13 Leah Way
- 4 Caileigh Ct
- 58 Blanchard St
- 69 Blanchard St
- 101 Bellevue Rd
- 25 Clubview Dr Unit 25
- 13 Clubview Dr Unit 13
- 18 Dale St Unit 4G