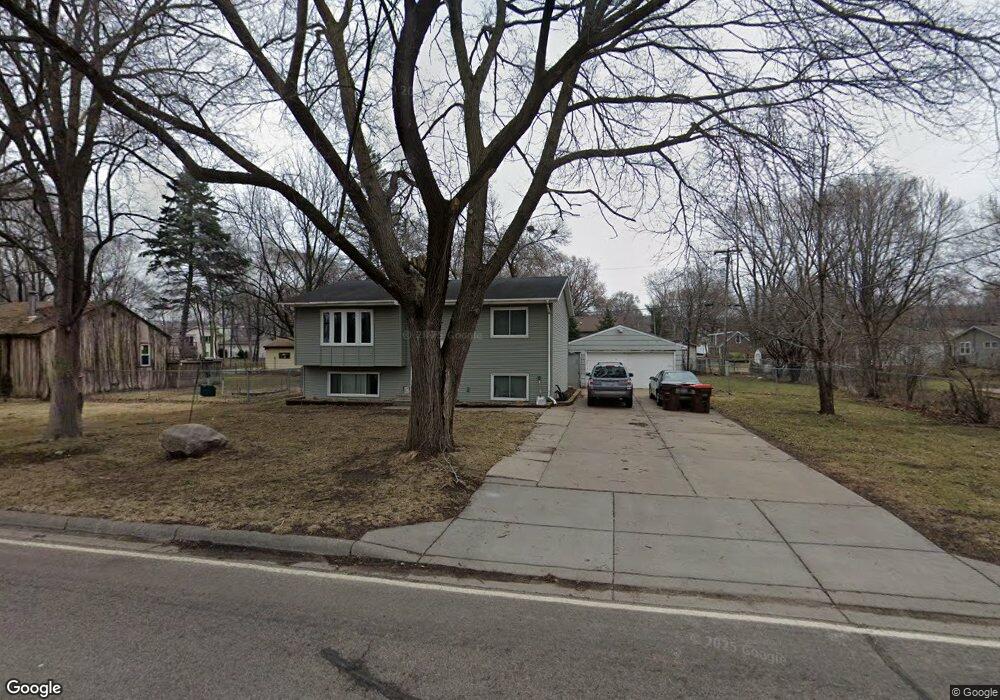
1282 4th Ave Newport, MN 55055
Estimated Value: $284,000 - $316,000
4
Beds
2
Baths
896
Sq Ft
$328/Sq Ft
Est. Value
About This Home
This home is located at 1282 4th Ave, Newport, MN 55055 and is currently estimated at $294,012, approximately $328 per square foot. 1282 4th Ave is a home located in Washington County with nearby schools including Newport Elementary School, Oltman Middle School, and East Ridge High School.
Ownership History
Date
Name
Owned For
Owner Type
Purchase Details
Closed on
Apr 29, 2005
Sold by
Nelson Michael R and Nelson Karalee D
Bought by
Dolney Christopher T and Dolney Silvia Tamayo
Current Estimated Value
Create a Home Valuation Report for This Property
The Home Valuation Report is an in-depth analysis detailing your home's value as well as a comparison with similar homes in the area
Home Values in the Area
Average Home Value in this Area
Purchase History
| Date | Buyer | Sale Price | Title Company |
|---|---|---|---|
| Dolney Christopher T | $200,000 | -- |
Source: Public Records
Tax History
| Year | Tax Paid | Tax Assessment Tax Assessment Total Assessment is a certain percentage of the fair market value that is determined by local assessors to be the total taxable value of land and additions on the property. | Land | Improvement |
|---|---|---|---|---|
| 2024 | $4,064 | $247,600 | $50,000 | $197,600 |
| 2023 | $4,064 | $273,400 | $80,000 | $193,400 |
| 2022 | $4,080 | $258,900 | $83,200 | $175,700 |
| 2021 | $3,268 | $213,300 | $69,000 | $144,300 |
| 2020 | $3,502 | $224,900 | $84,100 | $140,800 |
| 2019 | $2,990 | $212,800 | $70,000 | $142,800 |
| 2018 | $3,056 | $196,400 | $65,000 | $131,400 |
| 2017 | $2,502 | $184,200 | $57,000 | $127,200 |
| 2016 | $2,676 | $169,100 | $45,000 | $124,100 |
| 2015 | $1,938 | $113,600 | $31,300 | $82,300 |
| 2013 | -- | $107,900 | $29,200 | $78,700 |
Source: Public Records
Map
Nearby Homes
- 3XX 2nd Ave
- 1621 4th Ave
- 1391 12th Ave
- 465 3rd Ave
- 1690 2nd Ave
- 16XX Woodbury Rd
- 1761 8th Ave
- 1641 Concord St S
- 2250 Larry Ln
- 6226 62nd St S
- 6153 Goodview Ave S
- 6248 61st St S
- 6237 64th St S
- 6275 63rd St S
- 6299 63rd St S
- 6435 Dawn Way
- 6287 Crackleberry Trail
- 6538 Genevieve Trail
- TBD Broadway Ave
- 6548 Genevieve Trail
Your Personal Tour Guide
Ask me questions while you tour the home.