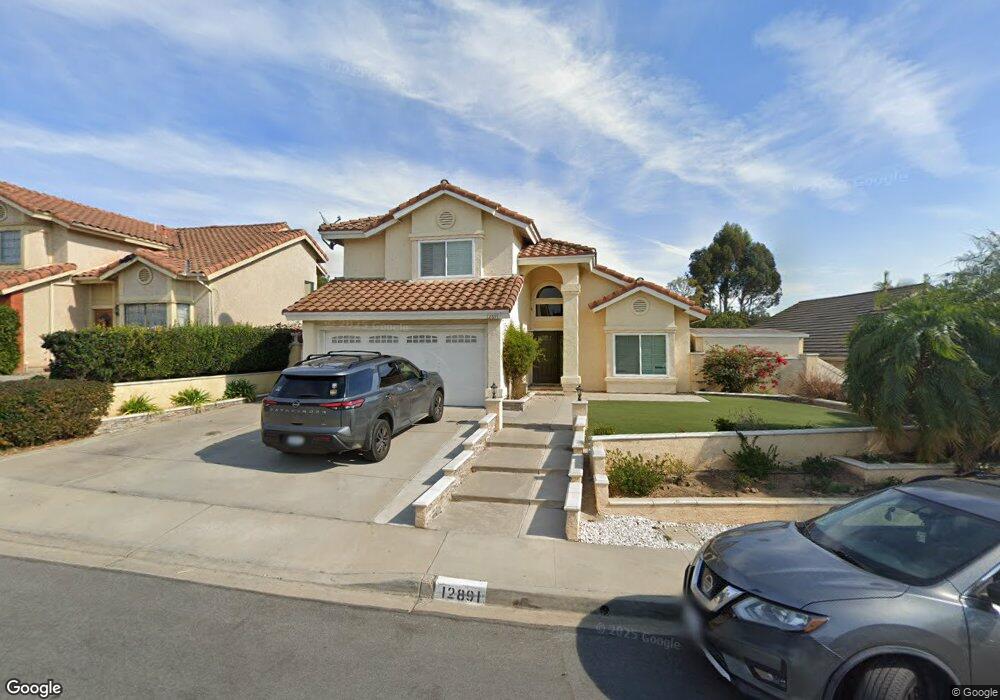
12891 Isocoma St San Diego, CA 92129
Rancho Peñasquitos NeighborhoodEstimated Value: $1,448,000 - $1,519,000
4
Beds
3
Baths
1,970
Sq Ft
$756/Sq Ft
Est. Value
About This Home
This home is located at 12891 Isocoma St, San Diego, CA 92129 and is currently estimated at $1,490,261, approximately $756 per square foot. 12891 Isocoma St is a home located in San Diego County with nearby schools including Canyon View Elementary School, Mesa Verde Middle School, and Westview High School.
Ownership History
Date
Name
Owned For
Owner Type
Purchase Details
Closed on
Dec 2, 2005
Sold by
Bollig Elizabeth
Bought by
Wallenrod Victor and Wallenrod Dorota
Current Estimated Value
Home Financials for this Owner
Home Financials are based on the most recent Mortgage that was taken out on this home.
Original Mortgage
$350,000
Outstanding Balance
$194,078
Interest Rate
6.14%
Mortgage Type
Fannie Mae Freddie Mac
Estimated Equity
$1,296,183
Purchase Details
Closed on
Feb 25, 2005
Sold by
Bollig Elizabeth L
Bought by
Bollig Elizabeth L
Home Financials for this Owner
Home Financials are based on the most recent Mortgage that was taken out on this home.
Original Mortgage
$487,500
Interest Rate
5.62%
Mortgage Type
Stand Alone Refi Refinance Of Original Loan
Purchase Details
Closed on
Mar 12, 2004
Sold by
Bollig Allen G
Bought by
Bollig Elizabeth L
Home Financials for this Owner
Home Financials are based on the most recent Mortgage that was taken out on this home.
Original Mortgage
$388,000
Interest Rate
5.65%
Mortgage Type
Stand Alone Refi Refinance Of Original Loan
Purchase Details
Closed on
Apr 1, 2002
Sold by
Bollig Allen J and Bollig Elizabeth L
Bought by
Bollig Allen G and Bollig Elizabeth L
Home Financials for this Owner
Home Financials are based on the most recent Mortgage that was taken out on this home.
Original Mortgage
$351,900
Interest Rate
7.6%
Purchase Details
Closed on
Feb 4, 2000
Sold by
Chesnut and Linda
Bought by
Bollig Allen and Gibson Elizabeth L
Home Financials for this Owner
Home Financials are based on the most recent Mortgage that was taken out on this home.
Original Mortgage
$236,000
Interest Rate
9.25%
Purchase Details
Closed on
Jan 26, 2000
Sold by
Gibson James Joseph
Bought by
Gibson Elizabeth L
Home Financials for this Owner
Home Financials are based on the most recent Mortgage that was taken out on this home.
Original Mortgage
$236,000
Interest Rate
9.25%
Purchase Details
Closed on
Nov 9, 1998
Sold by
Trinh and Christina
Bought by
Chesnut Dennis and Chesnut Linda
Home Financials for this Owner
Home Financials are based on the most recent Mortgage that was taken out on this home.
Original Mortgage
$253,650
Interest Rate
6.69%
Purchase Details
Closed on
Mar 18, 1998
Sold by
Trinh and Christina
Bought by
Trinh Sanh and Trinh Christina
Purchase Details
Closed on
Aug 16, 1991
Purchase Details
Closed on
Sep 27, 1985
Create a Home Valuation Report for This Property
The Home Valuation Report is an in-depth analysis detailing your home's value as well as a comparison with similar homes in the area
Home Values in the Area
Average Home Value in this Area
Purchase History
| Date | Buyer | Sale Price | Title Company |
|---|---|---|---|
| Wallenrod Victor | $650,000 | Commonwealth | |
| Bollig Elizabeth L | -- | Old Republic Title Company | |
| Bollig Elizabeth L | -- | Old Republic Title | |
| Bollig Allen G | -- | American Title Ins Co | |
| Bollig Allen | $300,000 | Chicago Title Co | |
| Gibson Elizabeth L | -- | Chicago Title Co | |
| Bollig Allen | -- | Chicago Title Co | |
| Chesnut Dennis | $267,000 | First American Title Ins Co | |
| Trinh Sanh | -- | -- | |
| -- | $221,500 | -- | |
| -- | $133,500 | -- |
Source: Public Records
Mortgage History
| Date | Status | Borrower | Loan Amount |
|---|---|---|---|
| Open | Wallenrod Victor | $350,000 | |
| Previous Owner | Bollig Elizabeth L | $487,500 | |
| Previous Owner | Bollig Elizabeth L | $388,000 | |
| Previous Owner | Bollig Allen G | $351,900 | |
| Previous Owner | Bollig Allen | $236,000 | |
| Previous Owner | Chesnut Dennis | $253,650 | |
| Closed | Bollig Allen | $59,000 | |
| Closed | Bollig Elizabeth L | $72,750 |
Source: Public Records
Tax History Compared to Growth
Tax History
| Year | Tax Paid | Tax Assessment Tax Assessment Total Assessment is a certain percentage of the fair market value that is determined by local assessors to be the total taxable value of land and additions on the property. | Land | Improvement |
|---|---|---|---|---|
| 2025 | $9,911 | $888,210 | $409,944 | $478,266 |
| 2024 | $9,911 | $870,795 | $401,906 | $468,889 |
| 2023 | $9,703 | $853,722 | $394,026 | $459,696 |
| 2022 | $9,548 | $836,983 | $386,300 | $450,683 |
| 2021 | $9,425 | $820,573 | $378,726 | $441,847 |
| 2020 | $8,871 | $775,000 | $353,000 | $422,000 |
| 2019 | $8,512 | $750,000 | $342,000 | $408,000 |
| 2018 | $7,864 | $700,000 | $320,000 | $380,000 |
| 2017 | $83 | $700,000 | $320,000 | $380,000 |
| 2016 | $7,343 | $660,000 | $302,000 | $358,000 |
| 2015 | $7,220 | $650,000 | $298,000 | $352,000 |
| 2014 | $7,189 | $650,000 | $298,000 | $352,000 |
Source: Public Records
Map
Nearby Homes
- 12776 Isocoma St Unit 4
- 9012 Buckwheat St
- 9068 Buckwheat St
- 12537 Ginger Snap Ct
- 8695 Rideabout Ln
- 8754 Park Run Rd
- 12573 Brickellia St
- 8672 Creekwood Ln
- 12880 War Horse St
- 12518 Darkwood Rd
- 9342 Twin Trails Dr Unit 303
- 12465 Pathos Ln
- 9446 Pipilo St
- 13146 Thunderhead St
- 12740 Prairie Dog Ave
- 9302 Twin Trails Dr Unit 204
- 12485 Picrus St
- 9525 Vervain St
- 9458 Twin Trails Dr Unit 205
- 13202 Salmon River Rd Unit 101
- 12919 Isocoma St
- 12879 Isocoma St
- 12867 Isocoma St
- 12929 Isocoma St
- 12838 Gambusa Way
- 12848 Gambusa Way
- 12855 Isocoma St
- 12828 Gambusa Way
- 12939 Isocoma St
- 12906 Isocoma St
- 12916 Isocoma St
- 12896 Isocoma St
- 12926 Isocoma St
- 12858 Gambusa Way
- 12886 Isocoma St
- 12843 Isocoma St
- 12949 Isocoma St
- 12936 Isocoma St
- 12876 Isocoma St
- 12870 Gambusa Way