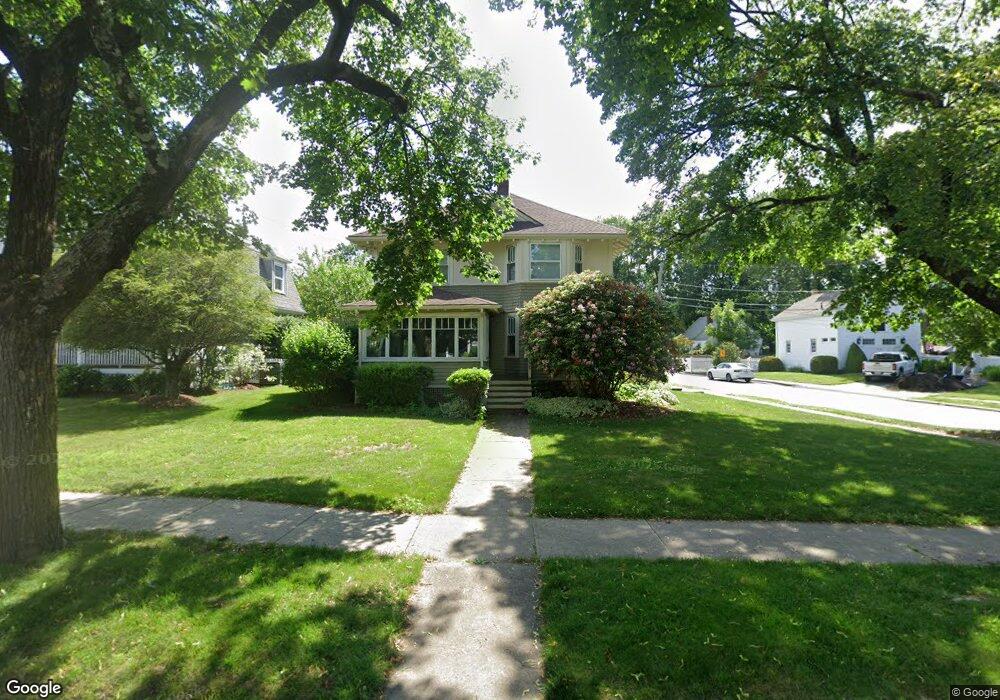
129 Common St Walpole, MA 02081
Estimated Value: $698,000 - $819,000
3
Beds
2
Baths
1,576
Sq Ft
$473/Sq Ft
Est. Value
About This Home
This home is located at 129 Common St, Walpole, MA 02081 and is currently estimated at $745,839, approximately $473 per square foot. 129 Common St is a home located in Norfolk County with nearby schools including Boyden School, Eleanor N. Johnson Middle School, and Walpole High School.
Ownership History
Date
Name
Owned For
Owner Type
Purchase Details
Closed on
Mar 13, 2021
Sold by
Macomber Tracey R
Bought by
Tracey R Macomber Lt and Macomber
Current Estimated Value
Purchase Details
Closed on
Jun 20, 2020
Sold by
Tracey R Macomber Lt and Macomber
Bought by
Macomber Tracey R
Home Financials for this Owner
Home Financials are based on the most recent Mortgage that was taken out on this home.
Original Mortgage
$165,000
Interest Rate
3.2%
Mortgage Type
New Conventional
Purchase Details
Closed on
Nov 20, 2015
Sold by
Macomber Tracey R
Bought by
Tracey R Macomber Lt and Macomber
Purchase Details
Closed on
Aug 27, 1999
Sold by
Common Street Etc
Bought by
Macomber Thomas D and Macomber Tracey R
Home Financials for this Owner
Home Financials are based on the most recent Mortgage that was taken out on this home.
Original Mortgage
$221,300
Interest Rate
7.53%
Mortgage Type
Purchase Money Mortgage
Create a Home Valuation Report for This Property
The Home Valuation Report is an in-depth analysis detailing your home's value as well as a comparison with similar homes in the area
Home Values in the Area
Average Home Value in this Area
Purchase History
| Date | Buyer | Sale Price | Title Company |
|---|---|---|---|
| Tracey R Macomber Lt | -- | None Available | |
| Macomber Tracey R | -- | First American Title | |
| Tracey R Macomber Lt | -- | -- | |
| Macomber Thomas D | $233,000 | -- |
Source: Public Records
Mortgage History
| Date | Status | Borrower | Loan Amount |
|---|---|---|---|
| Previous Owner | Macomber Tracey R | $165,000 | |
| Previous Owner | Macomber Thomas D | $166,000 | |
| Previous Owner | Macomber Thomas D | $214,700 | |
| Previous Owner | Macomber Thomas D | $221,300 |
Source: Public Records
Tax History
| Year | Tax Paid | Tax Assessment Tax Assessment Total Assessment is a certain percentage of the fair market value that is determined by local assessors to be the total taxable value of land and additions on the property. | Land | Improvement |
|---|---|---|---|---|
| 2025 | $8,807 | $686,400 | $352,100 | $334,300 |
| 2024 | $8,544 | $646,300 | $338,600 | $307,700 |
| 2023 | $8,267 | $595,200 | $294,400 | $300,800 |
| 2022 | $7,766 | $537,100 | $272,600 | $264,500 |
| 2021 | $7,405 | $499,000 | $257,100 | $241,900 |
| 2020 | $7,354 | $490,600 | $242,600 | $248,000 |
| 2019 | $7,003 | $463,800 | $233,300 | $230,500 |
| 2018 | $6,639 | $434,800 | $224,300 | $210,500 |
| 2017 | $6,419 | $418,700 | $215,600 | $203,100 |
| 2016 | $6,034 | $387,800 | $205,300 | $182,500 |
| 2015 | $5,795 | $369,100 | $195,000 | $174,100 |
| 2014 | $5,598 | $355,200 | $195,000 | $160,200 |
Source: Public Records
Map
Nearby Homes
- 50 Riverside Place
- 224 School St Unit 9
- 222 School St Unit 9
- 1110 Main St
- 145 South St Unit 5
- 881 Main St Unit 9
- 1391 Main St Unit 308
- 1391 Main St Unit 306
- 1391 Main St Unit 304
- 260 Elm St
- 56 North St
- 37 Alice Ave
- 31 Sandtrap Cir Unit 500
- 10 Sandtrap Cir Unit 2
- 13 Sandtrap Cir Unit 14
- 11 Sandtrap Cir Unit 15
- 20 Sandtrap Cir Unit 4
- 19 Sandtrap Cir Unit 11
- 18 Sandtrap Cir Unit 3
- 17 Sandtrap Cir Unit 12
Your Personal Tour Guide
Ask me questions while you tour the home.