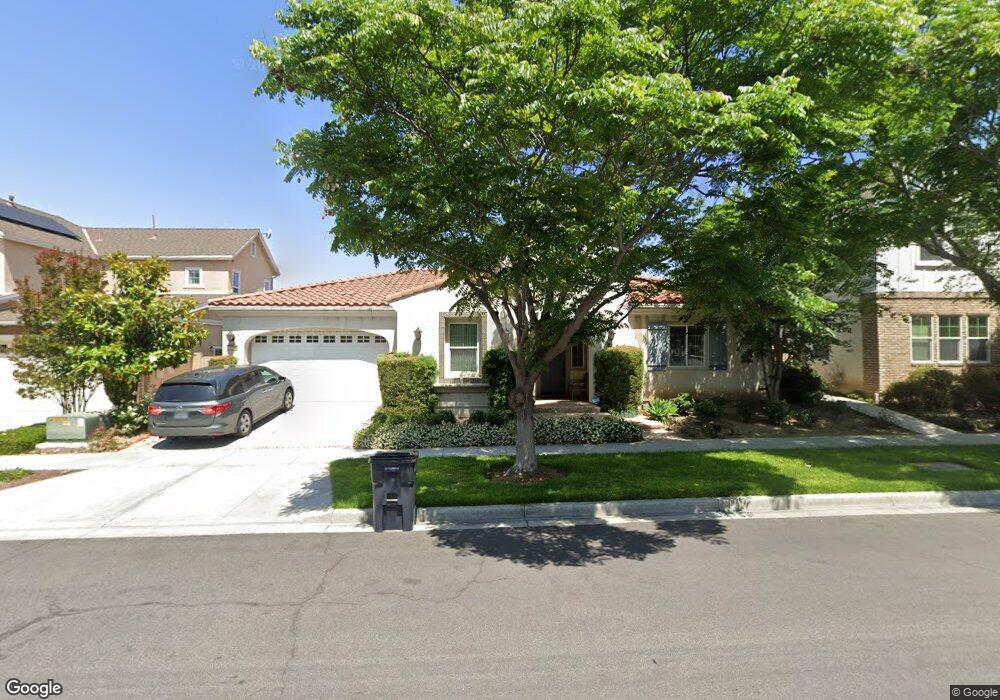
129 Compass Irvine, CA 92618
Great Park NeighborhoodEstimated Value: $1,614,089 - $2,382,000
3
Beds
2
Baths
1,746
Sq Ft
$1,140/Sq Ft
Est. Value
About This Home
This home is located at 129 Compass, Irvine, CA 92618 and is currently estimated at $1,991,022, approximately $1,140 per square foot. 129 Compass is a home with nearby schools including Beacon Park, Portola High School, and Woodbury Elementary School.
Ownership History
Date
Name
Owned For
Owner Type
Purchase Details
Closed on
Nov 14, 2013
Sold by
Lennar Homes Of California Inc
Bought by
Wong Anthony F and Wong Bonnie C
Current Estimated Value
Home Financials for this Owner
Home Financials are based on the most recent Mortgage that was taken out on this home.
Original Mortgage
$500,000
Outstanding Balance
$372,134
Interest Rate
4.18%
Mortgage Type
New Conventional
Estimated Equity
$1,618,888
Create a Home Valuation Report for This Property
The Home Valuation Report is an in-depth analysis detailing your home's value as well as a comparison with similar homes in the area
Home Values in the Area
Average Home Value in this Area
Purchase History
| Date | Buyer | Sale Price | Title Company |
|---|---|---|---|
| Wong Anthony F | $801,000 | North American Title |
Source: Public Records
Mortgage History
| Date | Status | Borrower | Loan Amount |
|---|---|---|---|
| Open | Wong Anthony F | $500,000 |
Source: Public Records
Tax History
| Year | Tax Paid | Tax Assessment Tax Assessment Total Assessment is a certain percentage of the fair market value that is determined by local assessors to be the total taxable value of land and additions on the property. | Land | Improvement |
|---|---|---|---|---|
| 2025 | $15,630 | $981,899 | $672,932 | $308,967 |
| 2024 | $15,630 | $962,647 | $659,738 | $302,909 |
| 2023 | $15,291 | $943,772 | $646,802 | $296,970 |
| 2022 | $14,991 | $925,267 | $634,119 | $291,148 |
| 2021 | $14,697 | $907,125 | $621,685 | $285,440 |
| 2020 | $14,600 | $897,824 | $615,310 | $282,514 |
| 2019 | $14,379 | $880,220 | $603,245 | $276,975 |
| 2018 | $14,097 | $862,961 | $591,416 | $271,545 |
| 2017 | $13,820 | $846,041 | $579,820 | $266,221 |
| 2016 | $13,550 | $829,452 | $568,451 | $261,001 |
| 2015 | $13,324 | $816,993 | $559,912 | $257,081 |
| 2014 | $13,063 | $800,990 | $548,944 | $252,046 |
Source: Public Records
Map
Nearby Homes
Your Personal Tour Guide
Ask me questions while you tour the home.