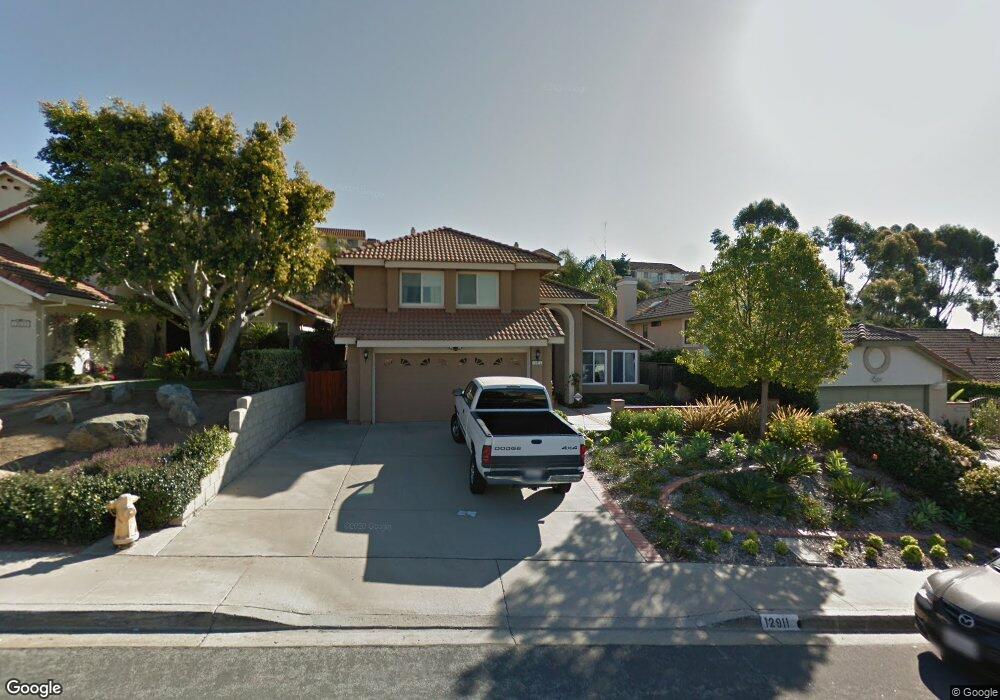
12911 Texana St San Diego, CA 92129
Rancho Peñasquitos NeighborhoodEstimated Value: $1,464,000 - $1,712,000
4
Beds
3
Baths
2,232
Sq Ft
$713/Sq Ft
Est. Value
About This Home
This home is located at 12911 Texana St, San Diego, CA 92129 and is currently estimated at $1,590,539, approximately $712 per square foot. 12911 Texana St is a home located in San Diego County with nearby schools including Canyon View Elementary School, Mesa Verde Middle School, and Westview High School.
Ownership History
Date
Name
Owned For
Owner Type
Purchase Details
Closed on
Sep 18, 2020
Sold by
Nassif Brian and Nassif Felicia
Bought by
Nassif Brian A and Nassif Felicia E
Current Estimated Value
Purchase Details
Closed on
Jun 19, 2013
Sold by
Balmenti Phillip Anthony and Balmenti Rachel Dries
Bought by
Nassif Brian and Nassif Felicia
Home Financials for this Owner
Home Financials are based on the most recent Mortgage that was taken out on this home.
Original Mortgage
$390,000
Outstanding Balance
$277,300
Interest Rate
3.48%
Mortgage Type
New Conventional
Estimated Equity
$1,313,239
Purchase Details
Closed on
Feb 8, 2012
Sold by
Balmenti Phillip Anthony and Balmenti Rachel Dries
Bought by
Balmenti Phillip Anthony and Balmenti Rachel Dries
Home Financials for this Owner
Home Financials are based on the most recent Mortgage that was taken out on this home.
Original Mortgage
$453,000
Interest Rate
3.84%
Mortgage Type
New Conventional
Purchase Details
Closed on
Dec 3, 2010
Sold by
Balmenti Phillip Anthony and Balmenti Rachel Dries
Bought by
Balmenti Phillip Anthony and Balmenti Rachel Dries
Purchase Details
Closed on
Jun 7, 2010
Sold by
Balmenti Phillip Anthony and Balmenti Rachel Dries
Bought by
Balmenti Phillip Anthony and Balmenti Rachel Dries
Purchase Details
Closed on
Nov 7, 2008
Sold by
Balmenti Phillip Anthony
Bought by
Balmenti Phillip Anthony and Balmenti Rachel Dries
Home Financials for this Owner
Home Financials are based on the most recent Mortgage that was taken out on this home.
Original Mortgage
$480,000
Interest Rate
6.07%
Mortgage Type
Stand Alone Refi Refinance Of Original Loan
Purchase Details
Closed on
Aug 12, 2005
Sold by
Welch Matt D and Welch Suzanne K
Bought by
Balmenti Phillip Anthony
Home Financials for this Owner
Home Financials are based on the most recent Mortgage that was taken out on this home.
Original Mortgage
$568,000
Interest Rate
5.75%
Mortgage Type
Fannie Mae Freddie Mac
Purchase Details
Closed on
Aug 20, 2004
Sold by
Mezzanatto Rory J and Mezzanatto Becky
Bought by
Welch Matt D and Welch Suzanne K
Home Financials for this Owner
Home Financials are based on the most recent Mortgage that was taken out on this home.
Original Mortgage
$544,000
Interest Rate
5.94%
Mortgage Type
New Conventional
Purchase Details
Closed on
Aug 4, 1988
Purchase Details
Closed on
Nov 13, 1985
Create a Home Valuation Report for This Property
The Home Valuation Report is an in-depth analysis detailing your home's value as well as a comparison with similar homes in the area
Home Values in the Area
Average Home Value in this Area
Purchase History
| Date | Buyer | Sale Price | Title Company |
|---|---|---|---|
| Nassif Brian A | -- | None Available | |
| Nassif Brian | $705,000 | Corinthian Title Company | |
| Balmenti Phillip Anthony | -- | First American Title Company | |
| Balmenti Phillip Anthony | -- | First American Title Company | |
| Balmenti Phillip Anthony | -- | Old Republic Title Company | |
| Balmenti Phillip Anthony | -- | Old Republic Title Company | |
| Balmenti Phillip Anthony | -- | None Available | |
| Balmenti Phillip Anthony | -- | Fidelity National Title Co | |
| Balmenti Phillip Anthony | $710,000 | First American Title Co | |
| Welch Matt D | $680,000 | First American Title | |
| -- | $194,000 | -- | |
| -- | $132,000 | -- |
Source: Public Records
Mortgage History
| Date | Status | Borrower | Loan Amount |
|---|---|---|---|
| Open | Nassif Brian | $390,000 | |
| Previous Owner | Balmenti Phillip Anthony | $453,000 | |
| Previous Owner | Balmenti Phillip Anthony | $480,000 | |
| Previous Owner | Balmenti Phillip Anthony | $568,000 | |
| Previous Owner | Welch Matt D | $544,000 |
Source: Public Records
Tax History Compared to Growth
Tax History
| Year | Tax Paid | Tax Assessment Tax Assessment Total Assessment is a certain percentage of the fair market value that is determined by local assessors to be the total taxable value of land and additions on the property. | Land | Improvement |
|---|---|---|---|---|
| 2025 | $9,690 | $868,143 | $398,601 | $469,542 |
| 2024 | $9,690 | $851,122 | $390,786 | $460,336 |
| 2023 | $9,486 | $834,434 | $383,124 | $451,310 |
| 2022 | $9,335 | $818,073 | $375,612 | $442,461 |
| 2021 | $9,214 | $802,034 | $368,248 | $433,786 |
| 2020 | $9,084 | $793,812 | $364,473 | $429,339 |
| 2019 | $8,830 | $778,248 | $357,327 | $420,921 |
| 2018 | $8,566 | $762,989 | $350,321 | $412,668 |
| 2017 | $83 | $748,029 | $343,452 | $404,577 |
| 2016 | $8,153 | $733,363 | $336,718 | $396,645 |
| 2015 | $8,019 | $722,349 | $331,661 | $390,688 |
| 2014 | $7,829 | $708,200 | $325,165 | $383,035 |
Source: Public Records
Map
Nearby Homes
- 12537 Ginger Snap Ct
- 12776 Isocoma St Unit 4
- 9012 Buckwheat St
- 8695 Rideabout Ln
- 9068 Buckwheat St
- 8754 Park Run Rd
- 12573 Brickellia St
- 8672 Creekwood Ln
- 12880 War Horse St
- 12518 Darkwood Rd
- 12740 Prairie Dog Ave
- 12465 Pathos Ln
- 13146 Thunderhead St
- 9342 Twin Trails Dr Unit 303
- 9446 Pipilo St
- 12485 Picrus St
- 9302 Twin Trails Dr Unit 204
- 9525 Vervain St
- 9458 Twin Trails Dr Unit 205
- 13202 Salmon River Rd Unit 101
- 12903 Texana St
- 12915 Texana St
- 12895 Texana St
- 12919 Texana St
- 12926 Isocoma St
- 12936 Isocoma St
- 12887 Texana St
- 12927 Texana St
- 12916 Isocoma St
- 12946 Isocoma St
- 12906 Isocoma St
- 12879 Texana St
- 12956 Isocoma St
- 12933 Texana St
- 12910 Texana St
- 12922 Texana St
- 12966 Isocoma St
- 12896 Isocoma St
- 12939 Texana St
- 12871 Texana St