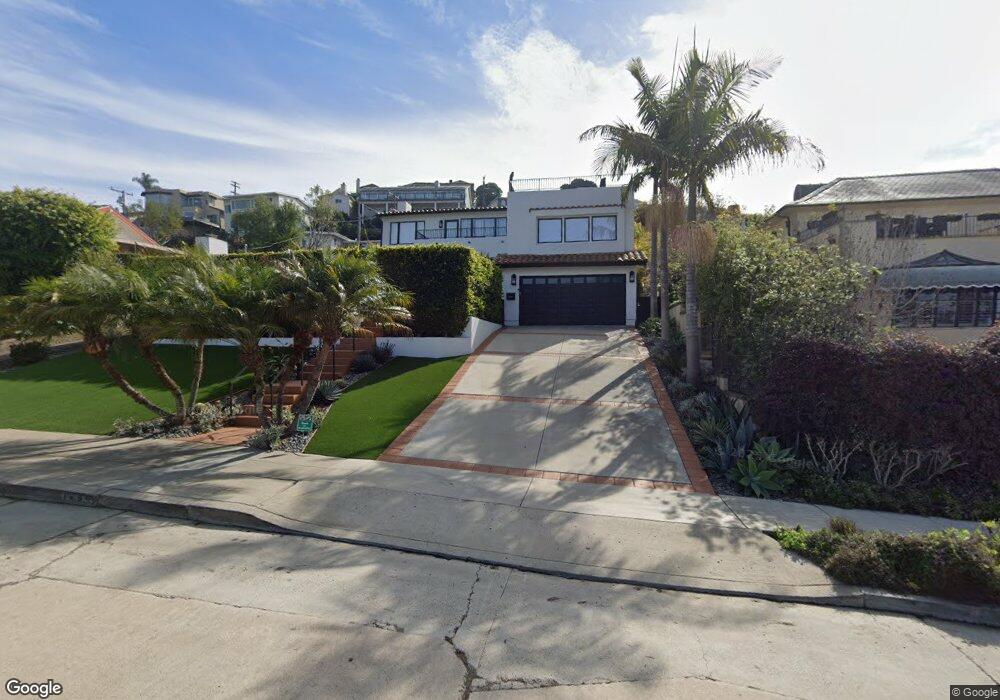
1299 Virginia Way La Jolla, CA 92037
The Village NeighborhoodEstimated Value: $3,665,000 - $4,436,000
3
Beds
3
Baths
2,515
Sq Ft
$1,570/Sq Ft
Est. Value
About This Home
This home is located at 1299 Virginia Way, La Jolla, CA 92037 and is currently estimated at $3,948,064, approximately $1,569 per square foot. 1299 Virginia Way is a home located in San Diego County with nearby schools including La Jolla Elementary School, Muirlands Middle School, and La Jolla High School.
Ownership History
Date
Name
Owned For
Owner Type
Purchase Details
Closed on
Aug 30, 2019
Sold by
Mara Scott A O and Mara Gale D O
Bought by
Hobbs Gregory and Hobbs Patricia
Current Estimated Value
Home Financials for this Owner
Home Financials are based on the most recent Mortgage that was taken out on this home.
Original Mortgage
$1,830,000
Outstanding Balance
$1,599,630
Interest Rate
3.5%
Mortgage Type
New Conventional
Estimated Equity
$2,348,434
Purchase Details
Closed on
May 11, 2019
Sold by
Sullivan Patrick T and Sullivan Teresa
Bought by
Sullivan Family Trust
Purchase Details
Closed on
Dec 18, 2007
Sold by
Sapp Joseph and Sapp Victoria A
Bought by
Omara Scott A and Omara Gale D
Purchase Details
Closed on
May 15, 2006
Sold by
Sapp Joseph
Bought by
Sapp Joseph and Sapp Victoria A
Purchase Details
Closed on
Oct 27, 2005
Sold by
Sapp Victoria
Bought by
Sapp Joseph
Home Financials for this Owner
Home Financials are based on the most recent Mortgage that was taken out on this home.
Original Mortgage
$1,818,750
Interest Rate
5.97%
Mortgage Type
Unknown
Purchase Details
Closed on
Sep 8, 2005
Sold by
Charkham Gary
Bought by
Sapp Joseph
Home Financials for this Owner
Home Financials are based on the most recent Mortgage that was taken out on this home.
Original Mortgage
$1,818,750
Interest Rate
5.97%
Mortgage Type
Unknown
Purchase Details
Closed on
Feb 4, 1999
Sold by
Noel Stuart
Bought by
Stuart Noel D and Stuart Paul S
Purchase Details
Closed on
Jun 1, 1998
Sold by
Noel Stuart
Bought by
Stuart Noel D and Stuart Paul S
Purchase Details
Closed on
Mar 26, 1998
Sold by
Charkham Gary
Bought by
Charkham Gary
Home Financials for this Owner
Home Financials are based on the most recent Mortgage that was taken out on this home.
Original Mortgage
$649,500
Interest Rate
6.62%
Purchase Details
Closed on
Dec 26, 1997
Sold by
Noel Stuart
Bought by
Stuart Noel D and Stuart Paul S
Purchase Details
Closed on
Apr 16, 1997
Sold by
Huff William A and Tasman Properties Trust
Bought by
Charkham Gary
Home Financials for this Owner
Home Financials are based on the most recent Mortgage that was taken out on this home.
Original Mortgage
$735,000
Interest Rate
7.86%
Mortgage Type
Seller Take Back
Purchase Details
Closed on
Jun 19, 1996
Sold by
Buss Paul
Bought by
Huff William A
Purchase Details
Closed on
Feb 29, 1996
Sold by
Andreasen Ilse
Bought by
Buss Paul
Home Financials for this Owner
Home Financials are based on the most recent Mortgage that was taken out on this home.
Original Mortgage
$189,900
Interest Rate
6.87%
Purchase Details
Closed on
Mar 29, 1995
Sold by
Andreasen Ilse
Bought by
Andreasen Ilse
Create a Home Valuation Report for This Property
The Home Valuation Report is an in-depth analysis detailing your home's value as well as a comparison with similar homes in the area
Home Values in the Area
Average Home Value in this Area
Purchase History
| Date | Buyer | Sale Price | Title Company |
|---|---|---|---|
| Hobbs Gregory | $2,480,000 | Chicago Title Company Sd | |
| Sullivan Family Trust | -- | None Available | |
| Omara Scott A | $2,012,000 | Chicago Title Company | |
| Sapp Joseph | -- | None Available | |
| Sapp Joseph | -- | Chicago Title | |
| Sapp Joseph | $2,425,000 | Chicago Title Company | |
| Stuart Noel D | -- | -- | |
| Stuart Noel D | -- | -- | |
| Charkham Gary | -- | Lawyers Title Company | |
| Stuart Noel D | -- | -- | |
| Charkham Gary | $30,000 | First American Title | |
| Huff William A | -- | -- | |
| Buss Paul | $396,500 | First American Title | |
| Andreasen Ilse | -- | -- |
Source: Public Records
Mortgage History
| Date | Status | Borrower | Loan Amount |
|---|---|---|---|
| Open | Hobbs Gregory | $1,830,000 | |
| Previous Owner | Sapp Joseph | $1,818,750 | |
| Previous Owner | Charkham Gary | $649,500 | |
| Previous Owner | Charkham Gary | $735,000 | |
| Previous Owner | Buss Paul | $189,900 |
Source: Public Records
Tax History Compared to Growth
Tax History
| Year | Tax Paid | Tax Assessment Tax Assessment Total Assessment is a certain percentage of the fair market value that is determined by local assessors to be the total taxable value of land and additions on the property. | Land | Improvement |
|---|---|---|---|---|
| 2025 | $32,690 | $2,712,238 | $2,241,973 | $470,265 |
| 2024 | $32,690 | $2,659,058 | $2,198,013 | $461,045 |
| 2023 | $31,971 | $2,606,920 | $2,154,915 | $452,005 |
| 2022 | $31,121 | $2,555,805 | $2,112,662 | $443,143 |
| 2021 | $30,908 | $2,505,692 | $2,071,238 | $434,454 |
| 2020 | $30,532 | $2,480,000 | $2,050,000 | $430,000 |
| 2019 | $29,220 | $2,369,116 | $1,883,992 | $485,124 |
| 2018 | $27,315 | $2,322,663 | $1,847,051 | $475,612 |
| 2017 | $80 | $2,277,122 | $1,810,835 | $466,287 |
| 2016 | $26,246 | $2,232,474 | $1,775,329 | $457,145 |
| 2015 | $25,858 | $2,198,941 | $1,748,662 | $450,279 |
| 2014 | $25,448 | $2,155,868 | $1,714,409 | $441,459 |
Source: Public Records
Map
Nearby Homes
- 7569 Pepita Way
- 1138 Virginia Way
- 7651 Country Club Dr
- 7505 Pepita Way
- 1428 Soledad Ave
- 1461 Virginia Way
- 7733 Girard Ave Unit 13
- 7452 Herschel Ave
- 1586 Crespo Dr
- 7601 Eads Ave
- 7757 Eads Ave Unit B7
- 7560 Eads Ave Unit 12
- 1640 Ludington Ln
- 1624 Torrey Pines Rd
- 1040 Genter St Unit 103
- 1040 Genter St Unit 104
- 1659 Torrey Pines Rd
- 7376 Fay Ave
- 726 Silver St
- 708 Silver St
- 000 Olivet St Unit A
- 1301 Virginia Way
- 1267 Olivet St
- 1321 Virginia Way
- 1259 Olivet St
- 1271 Virginia Way
- 1311 Olivet St
- 1253 Olivet St
- 1263 Virginia Way
- 1304 Virginia Way
- 1325 Virginia Way
- 7644 Mar Ave
- 7638 Mar Ave
- 7632 Mar Ave
- 1314 Virginia Way
- 1251 Olivet St
- 7664 Mar Ave
- 7622 Mar Ave
- 1257 Virginia Way
- 1252 Virginia Way