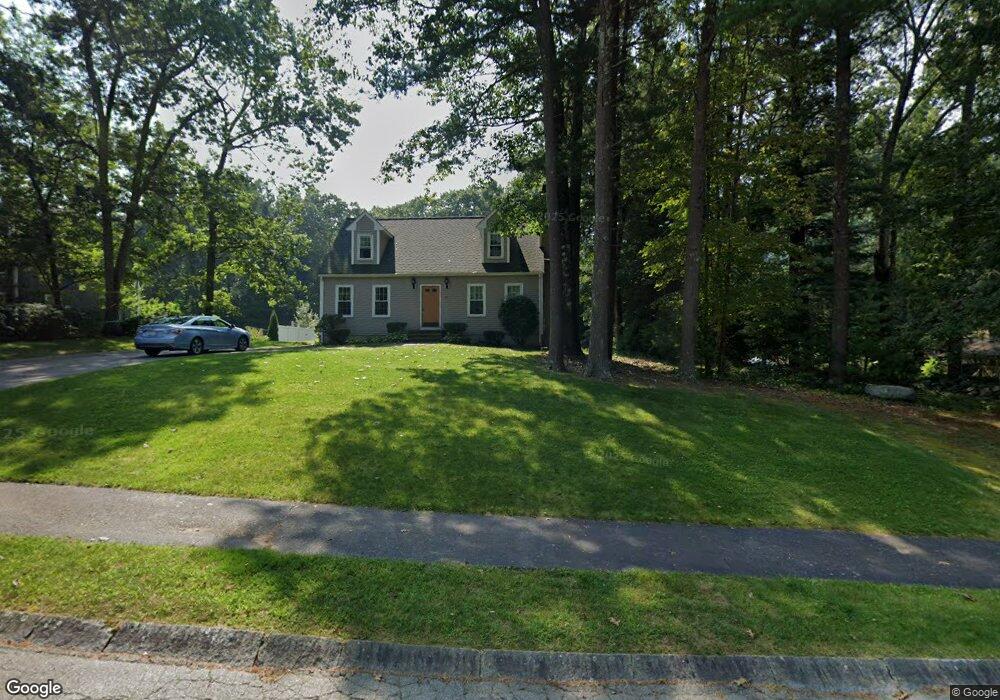
13 Baron Rd Franklin, MA 02038
Estimated Value: $680,000 - $754,000
3
Beds
2
Baths
1,800
Sq Ft
$389/Sq Ft
Est. Value
About This Home
This home is located at 13 Baron Rd, Franklin, MA 02038 and is currently estimated at $701,044, approximately $389 per square foot. 13 Baron Rd is a home located in Norfolk County with nearby schools including John F. Kennedy Memorial School, Horace Mann Middle School, and Franklin High School.
Ownership History
Date
Name
Owned For
Owner Type
Purchase Details
Closed on
Jul 27, 2001
Sold by
Balest Richard and Balest Lori
Bought by
Benham Thomas J and Benham Carol
Current Estimated Value
Purchase Details
Closed on
Mar 22, 1989
Sold by
Marguerite Bldg
Bought by
Damico J Richard
Create a Home Valuation Report for This Property
The Home Valuation Report is an in-depth analysis detailing your home's value as well as a comparison with similar homes in the area
Purchase History
| Date | Buyer | Sale Price | Title Company |
|---|---|---|---|
| Benham Thomas J | $314,000 | -- | |
| Damico J Richard | $165,000 | -- |
Source: Public Records
Mortgage History
| Date | Status | Borrower | Loan Amount |
|---|---|---|---|
| Open | Damico J Richard | $48,100 |
Source: Public Records
Tax History
| Year | Tax Paid | Tax Assessment Tax Assessment Total Assessment is a certain percentage of the fair market value that is determined by local assessors to be the total taxable value of land and additions on the property. | Land | Improvement |
|---|---|---|---|---|
| 2025 | $6,837 | $588,400 | $329,900 | $258,500 |
| 2024 | $6,826 | $579,000 | $329,900 | $249,100 |
| 2023 | $6,521 | $518,400 | $281,200 | $237,200 |
| 2022 | $6,042 | $430,000 | $221,400 | $208,600 |
| 2021 | $6,097 | $416,200 | $248,600 | $167,600 |
| 2020 | $5,768 | $397,500 | $238,400 | $159,100 |
| 2019 | $5,678 | $387,300 | $228,200 | $159,100 |
| 2018 | $5,308 | $362,300 | $220,100 | $142,200 |
| 2017 | $5,045 | $346,000 | $203,800 | $142,200 |
| 2016 | $5,207 | $359,100 | $218,700 | $140,400 |
| 2015 | $5,166 | $348,100 | $207,700 | $140,400 |
| 2014 | $4,662 | $322,600 | $182,200 | $140,400 |
Source: Public Records
Map
Nearby Homes
- 276 Pond St
- 41 Kimberlee Ave
- 201 Crossfield Rd
- 27 Dover Cir
- 8 Riverstone Way
- 60 Pine St
- 25 Brookview Rd
- 1801 Franklin Crossing Rd Unit 1801
- 214 Conlyn Ave
- 17 Pine St
- 602 Franklin Crossing Rd Unit 602
- 20 Hawthorne Village Unit A
- 18 Mary Anne Dr
- 8 Woodhaven Dr
- 834-836 W Central St
- 29 Elm St
- 8 Apache Rd
- 70 Oak St
- 4 Linda Ln
- 44 Arapahoe Rd
Your Personal Tour Guide
Ask me questions while you tour the home.