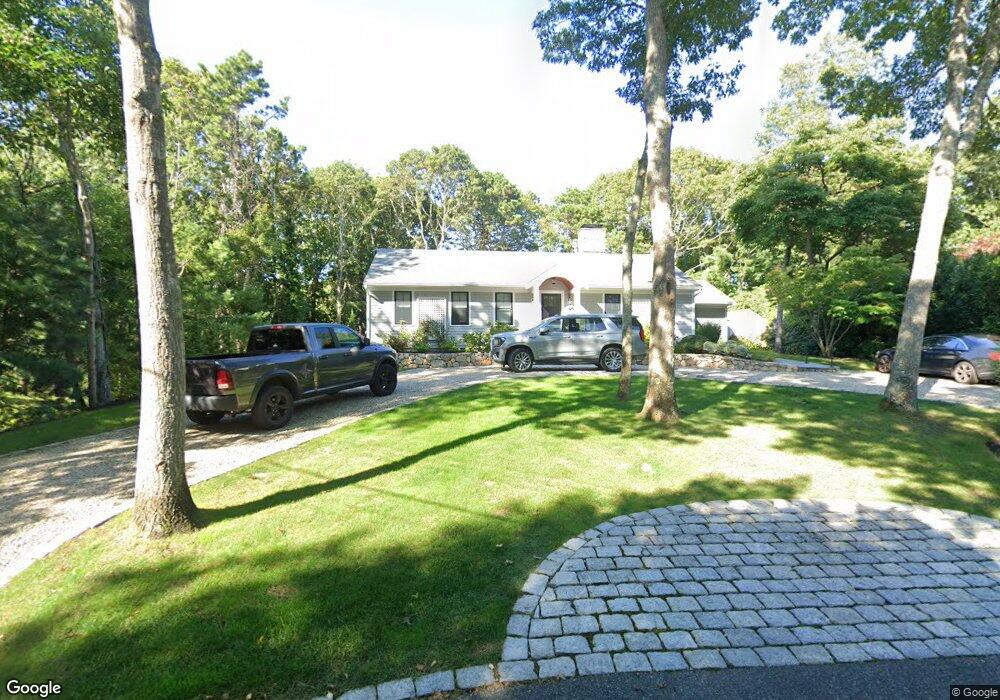
13 Bosuns Ln Mashpee, MA 02649
New Seabury-Popponesset Island NeighborhoodEstimated Value: $1,272,000 - $2,009,000
2
Beds
2
Baths
1,201
Sq Ft
$1,297/Sq Ft
Est. Value
About This Home
This home is located at 13 Bosuns Ln, Mashpee, MA 02649 and is currently estimated at $1,557,311, approximately $1,296 per square foot. 13 Bosuns Ln is a home located in Barnstable County with nearby schools including Kenneth C. Coombs School, Quashnet School, and Mashpee Middle School.
Ownership History
Date
Name
Owned For
Owner Type
Purchase Details
Closed on
Jan 15, 1999
Sold by
Reiss Alfred A and Reiss Edythe S
Bought by
Grosso Edwin H and Grosso Cheryl A
Current Estimated Value
Home Financials for this Owner
Home Financials are based on the most recent Mortgage that was taken out on this home.
Original Mortgage
$138,600
Outstanding Balance
$30,546
Interest Rate
6.7%
Mortgage Type
Purchase Money Mortgage
Estimated Equity
$1,526,765
Create a Home Valuation Report for This Property
The Home Valuation Report is an in-depth analysis detailing your home's value as well as a comparison with similar homes in the area
Home Values in the Area
Average Home Value in this Area
Purchase History
| Date | Buyer | Sale Price | Title Company |
|---|---|---|---|
| Grosso Edwin H | $154,000 | -- |
Source: Public Records
Mortgage History
| Date | Status | Borrower | Loan Amount |
|---|---|---|---|
| Open | Grosso Edwin H | $138,600 |
Source: Public Records
Tax History Compared to Growth
Tax History
| Year | Tax Paid | Tax Assessment Tax Assessment Total Assessment is a certain percentage of the fair market value that is determined by local assessors to be the total taxable value of land and additions on the property. | Land | Improvement |
|---|---|---|---|---|
| 2025 | $7,079 | $1,069,300 | $368,500 | $700,800 |
| 2024 | $5,321 | $827,600 | $335,100 | $492,500 |
| 2023 | $3,689 | $526,200 | $294,500 | $231,700 |
| 2022 | $3,525 | $431,400 | $239,400 | $192,000 |
| 2021 | $3,461 | $381,600 | $215,700 | $165,900 |
| 2020 | $3,494 | $384,400 | $224,700 | $159,700 |
| 2019 | $3,374 | $372,800 | $224,700 | $148,100 |
| 2018 | $3,207 | $359,500 | $224,700 | $134,800 |
| 2017 | $3,175 | $345,500 | $224,700 | $120,800 |
| 2016 | $3,114 | $337,000 | $224,700 | $112,300 |
| 2015 | $3,028 | $332,400 | $224,700 | $107,700 |
| 2014 | $3,075 | $327,500 | $221,300 | $106,200 |
Source: Public Records
Map
Nearby Homes
- 160 Waterway
- 30 Bright Coves Way
- 24 Spoondrift Way
- 8 Taffrail Way
- 20 Holly Rd
- 21 Fiddler Crab Ln
- 102 Summersea Rd
- 140 Summersea Rd
- 14 Azalea Ln
- 128 Uncle Percys Rd
- 42 Kim Path
- 28 Blue Castle Dr
- 444 Vineyard Rd
- 6 Heron Way
- 55 Blue Castle Dr
- 17 Degrass Rd
- 42 Fells Pond Rd
- 12 Tracey Rd
- 239 Clamshell Cove Rd
- 7 Blue Fin