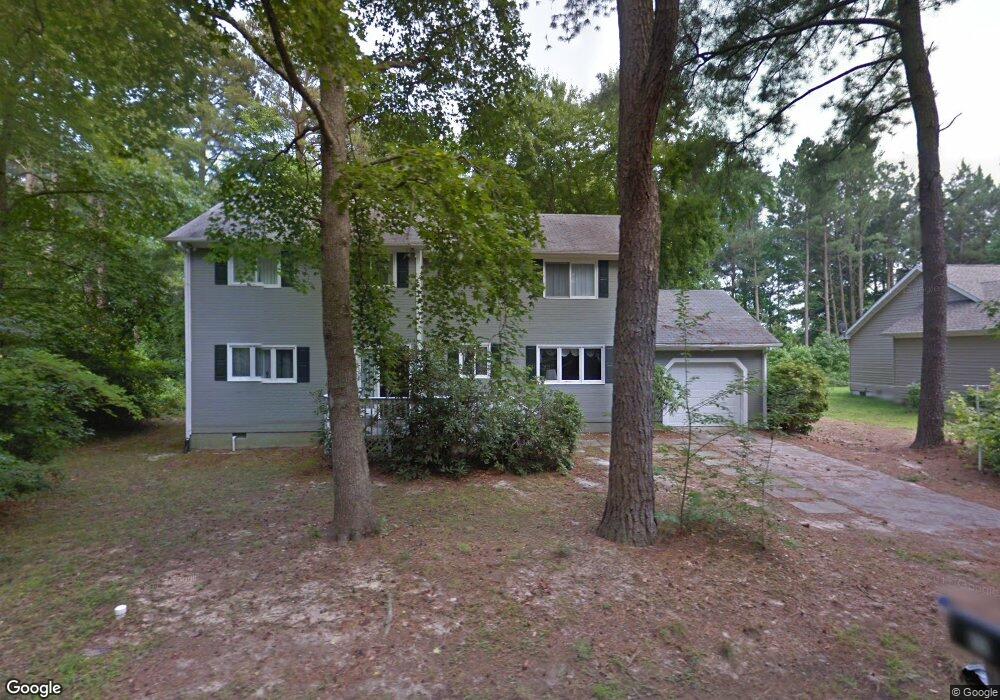
13 Calgary Ave Ocean View, DE 19970
Estimated Value: $325,000 - $342,000
3
Beds
--
Bath
1,308
Sq Ft
$254/Sq Ft
Est. Value
About This Home
This home is located at 13 Calgary Ave, Ocean View, DE 19970 and is currently estimated at $331,984, approximately $253 per square foot. 13 Calgary Ave is a home located in Sussex County with nearby schools including Lord Baltimore Elementary School, Selbyville Middle School, and Indian River High School.
Ownership History
Date
Name
Owned For
Owner Type
Purchase Details
Closed on
May 22, 2020
Sold by
Pletcher Sara M
Bought by
Marchais Richard T
Current Estimated Value
Home Financials for this Owner
Home Financials are based on the most recent Mortgage that was taken out on this home.
Original Mortgage
$232,222
Outstanding Balance
$205,781
Interest Rate
3.3%
Estimated Equity
$126,203
Purchase Details
Closed on
May 9, 2012
Sold by
Matthew J Matthew J
Bought by
Pletcher Sara M
Home Financials for this Owner
Home Financials are based on the most recent Mortgage that was taken out on this home.
Original Mortgage
$168,201
Interest Rate
3.88%
Purchase Details
Closed on
May 8, 2012
Sold by
Matthew J Matthew J
Bought by
Pletcher Sara M
Home Financials for this Owner
Home Financials are based on the most recent Mortgage that was taken out on this home.
Original Mortgage
$168,201
Interest Rate
3.88%
Create a Home Valuation Report for This Property
The Home Valuation Report is an in-depth analysis detailing your home's value as well as a comparison with similar homes in the area
Home Values in the Area
Average Home Value in this Area
Purchase History
| Date | Buyer | Sale Price | Title Company |
|---|---|---|---|
| Marchais Richard T | $229,900 | None Available | |
| Pletcher Sara M | $169,900 | -- | |
| Pletcher Sara M | $169,900 | -- |
Source: Public Records
Mortgage History
| Date | Status | Borrower | Loan Amount |
|---|---|---|---|
| Open | Marchais Richard T | $232,222 | |
| Previous Owner | Pletcher Sara M | $168,201 | |
| Previous Owner | Pletcher Sara M | $168,201 |
Source: Public Records
Tax History
| Year | Tax Paid | Tax Assessment Tax Assessment Total Assessment is a certain percentage of the fair market value that is determined by local assessors to be the total taxable value of land and additions on the property. | Land | Improvement |
|---|---|---|---|---|
| 2025 | $887 | $14,850 | $950 | $13,900 |
| 2024 | $795 | $14,850 | $950 | $13,900 |
| 2023 | $826 | $14,850 | $950 | $13,900 |
| 2022 | $813 | $14,850 | $950 | $13,900 |
| 2021 | $822 | $14,850 | $950 | $13,900 |
| 2020 | $825 | $14,850 | $950 | $13,900 |
| 2019 | $832 | $14,850 | $950 | $13,900 |
| 2018 | $836 | $14,850 | $0 | $0 |
| 2017 | $846 | $14,850 | $0 | $0 |
| 2016 | $917 | $14,850 | $0 | $0 |
| 2015 | $645 | $14,850 | $0 | $0 |
| 2014 | $623 | $14,850 | $0 | $0 |
Source: Public Records
Map
Nearby Homes
- 36028 Jackson St
- 380 Scranton
- 36016 Jackson St
- 11 Jodi Ct
- 36038 Jackson St
- 27 John Hall Dr Unit 39
- 36 John Hall Dr
- 36025 Jackson St
- 36041 Jackson St
- 15114 Tranquility Ln
- 36031 Jackson St
- 36037 Jackson St
- 10 Mitchell Ave
- 0 Ogre (Lot 9) Dr
- 18 Ocean Mist Dr
- 33280 Sassafras Ct
- 33010 Ogre Dr
- 32818 Venta Dr
- 2 Assawoman Ave
- 880 Garfield Pkwy Unit B
Your Personal Tour Guide
Ask me questions while you tour the home.