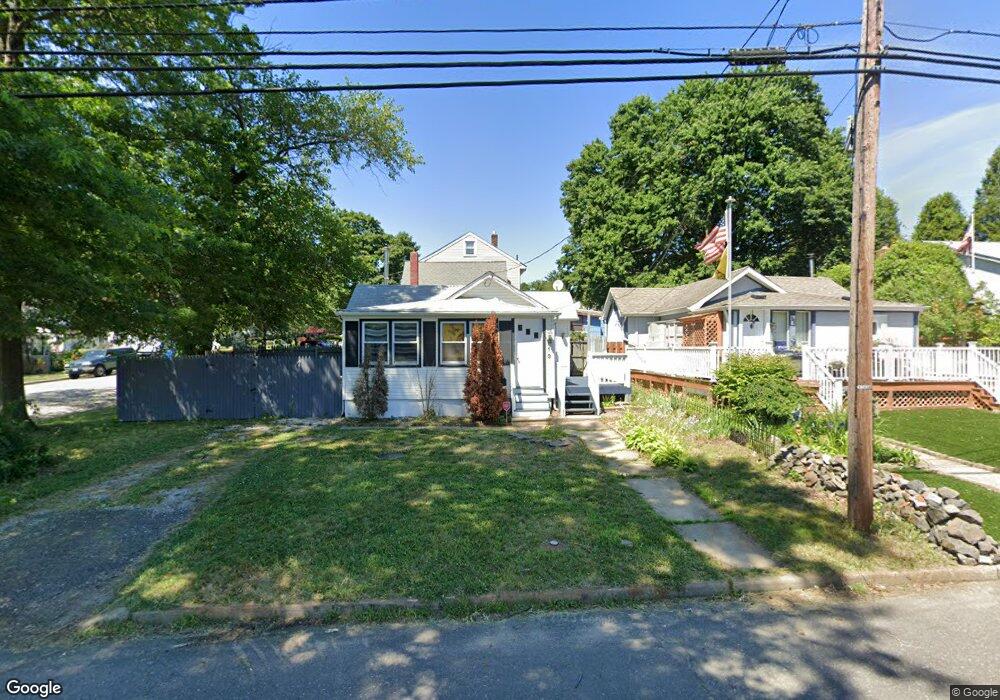
13 Highland Ave Leonardo, NJ 07737
Estimated Value: $309,000 - $373,000
1
Bed
1
Bath
589
Sq Ft
$576/Sq Ft
Est. Value
About This Home
This home is located at 13 Highland Ave, Leonardo, NJ 07737 and is currently estimated at $339,157, approximately $575 per square foot. 13 Highland Ave is a home located in Monmouth County with nearby schools including Leonardo Elementary School, Bayshore Middle School, and Middletown - South High School.
Ownership History
Date
Name
Owned For
Owner Type
Purchase Details
Closed on
Jun 26, 2015
Sold by
Dc Residential Acquisition Co Llc
Bought by
Capc Nj Asf 1 Llc
Current Estimated Value
Purchase Details
Closed on
Jun 24, 2015
Sold by
Trusts Christiana
Bought by
Dc Residential Acquisition Co Llc
Purchase Details
Closed on
Jul 10, 2008
Sold by
Jaccard Marilyn
Bought by
Overs Cynthia
Home Financials for this Owner
Home Financials are based on the most recent Mortgage that was taken out on this home.
Original Mortgage
$186,572
Interest Rate
6.17%
Mortgage Type
FHA
Purchase Details
Closed on
Nov 16, 2004
Sold by
Cpo Properties Llc
Bought by
Jaccard Marilyn
Home Financials for this Owner
Home Financials are based on the most recent Mortgage that was taken out on this home.
Original Mortgage
$133,600
Interest Rate
5.63%
Create a Home Valuation Report for This Property
The Home Valuation Report is an in-depth analysis detailing your home's value as well as a comparison with similar homes in the area
Home Values in the Area
Average Home Value in this Area
Purchase History
| Date | Buyer | Sale Price | Title Company |
|---|---|---|---|
| Capc Nj Asf 1 Llc | $166,578 | Fortune Title Agency Inc | |
| Dc Residential Acquisition Co Llc | -- | Fortune Title Agency Inc | |
| Overs Cynthia | $189,500 | Trident Abstract Title Agenc | |
| Jaccard Marilyn | $167,000 | -- |
Source: Public Records
Mortgage History
| Date | Status | Borrower | Loan Amount |
|---|---|---|---|
| Previous Owner | Overs Cynthia | $186,572 | |
| Previous Owner | Jaccard Marilyn | $133,600 |
Source: Public Records
Tax History Compared to Growth
Tax History
| Year | Tax Paid | Tax Assessment Tax Assessment Total Assessment is a certain percentage of the fair market value that is determined by local assessors to be the total taxable value of land and additions on the property. | Land | Improvement |
|---|---|---|---|---|
| 2025 | $4,231 | $335,000 | $280,600 | $54,400 |
| 2024 | $4,467 | $257,200 | $203,800 | $53,400 |
| 2023 | $4,467 | $257,000 | $190,700 | $66,300 |
| 2022 | $2,672 | $227,700 | $157,000 | $70,700 |
| 2021 | $2,672 | $132,200 | $109,700 | $22,500 |
| 2020 | $2,647 | $123,800 | $102,400 | $21,400 |
| 2019 | $2,598 | $123,000 | $101,900 | $21,100 |
| 2018 | $2,340 | $108,000 | $92,600 | $15,400 |
| 2017 | $3,067 | $140,100 | $92,600 | $47,500 |
| 2016 | $3,000 | $140,800 | $92,600 | $48,200 |
| 2015 | $3,107 | $140,800 | $92,600 | $48,200 |
| 2014 | $3,091 | $136,600 | $92,600 | $44,000 |
Source: Public Records
Map
Nearby Homes
- 46 Highland Ave
- 17 Washington Ave
- 13 Brant Dr Unit Lot 5.09
- 43 Washington Ave
- 16 Brant Dr Unit Lot 5.08
- 5 Brant Dr Unit Lot 5.13
- 10 Brant Dr Unit Lot 5.05
- 7 Brant Dr Unit Lot 5.12
- 4 Brant Dr Unit Lot 5.02
- 41 South Ave
- 58 W Highland Ave
- 54 W Washington Ave
- 786 Leonardville Rd
- 52 W Highland Ave
- 11 Brant Dr Unit Lot 5.10
- 46 Hosford Ave
- 28 Florence Ave
- 86 Washington Ave
- 7 Harbor View Dr
- 125 Oakland Ave
- 11 Highland Ave
- 132 Chamone Ave
- 130 Chamone Ave
- 128 Chamone Ave
- 9 Highland Ave
- 131 Chamone Ave
- 129 Chamone Ave
- 127 Chamone Ave
- 126 Chamone Ave
- 159 Mabel Ave
- 18 Highland Ave
- 125 Chamone Ave
- 15 Highland Ave
- 24 Raritan Ave
- 155 Mabel Ave
- 7 Highland Ave
- 20 Raritan Ave
- 162 Mabel Ave
- 123 Chamone Ave
- 151 Washington Ave