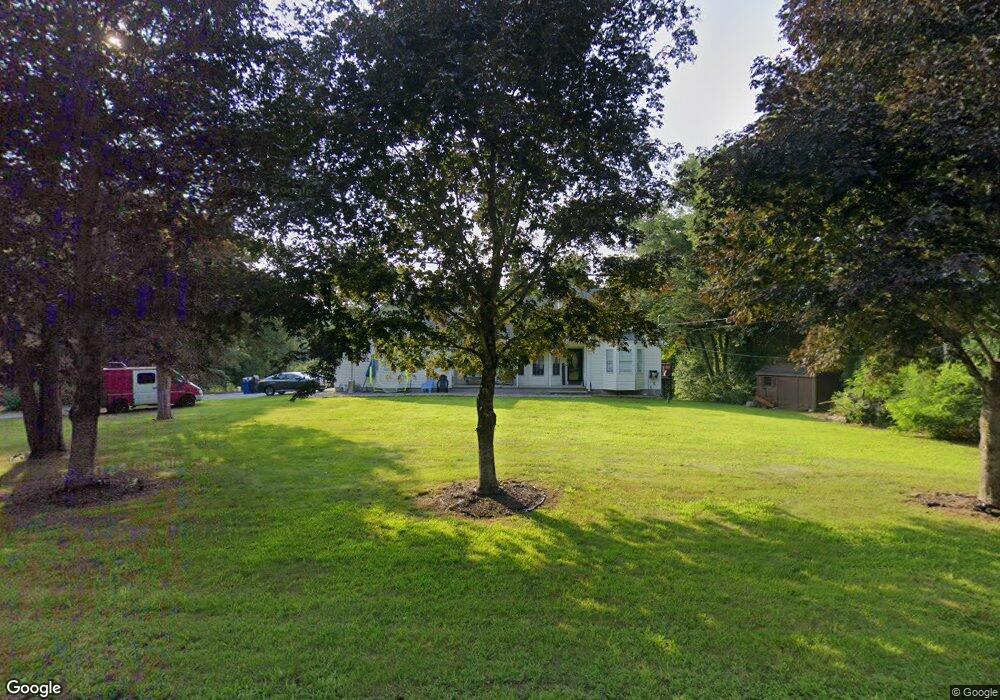
13 Juniper Ln Moosup, CT 06354
Estimated Value: $455,000 - $508,000
3
Beds
2
Baths
2,003
Sq Ft
$238/Sq Ft
Est. Value
About This Home
This home is located at 13 Juniper Ln, Moosup, CT 06354 and is currently estimated at $475,893, approximately $237 per square foot. 13 Juniper Ln is a home located in Windham County with nearby schools including Plainfield Memorial School, Plainfield Central Middle School, and Plainfield High School.
Ownership History
Date
Name
Owned For
Owner Type
Purchase Details
Closed on
Jan 24, 2020
Sold by
Greczkowski Roy A and Greczkowski Christine D
Bought by
Bolinger Stephen H
Current Estimated Value
Home Financials for this Owner
Home Financials are based on the most recent Mortgage that was taken out on this home.
Original Mortgage
$199,000
Outstanding Balance
$176,264
Interest Rate
3.73%
Mortgage Type
Purchase Money Mortgage
Estimated Equity
$299,629
Purchase Details
Closed on
Jul 1, 1999
Sold by
Corson Charles W
Bought by
Greczkowski Roy A and Greczkowsi Christine D
Home Financials for this Owner
Home Financials are based on the most recent Mortgage that was taken out on this home.
Original Mortgage
$165,600
Interest Rate
7.19%
Create a Home Valuation Report for This Property
The Home Valuation Report is an in-depth analysis detailing your home's value as well as a comparison with similar homes in the area
Home Values in the Area
Average Home Value in this Area
Purchase History
| Date | Buyer | Sale Price | Title Company |
|---|---|---|---|
| Bolinger Stephen H | $249,000 | None Available | |
| Bolinger Stephen H | $249,000 | None Available | |
| Greczkowski Roy A | $30,000 | -- | |
| Greczkowski Roy A | $30,000 | -- |
Source: Public Records
Mortgage History
| Date | Status | Borrower | Loan Amount |
|---|---|---|---|
| Open | Bolinger Stephen H | $199,000 | |
| Closed | Bolinger Stephen H | $199,000 | |
| Previous Owner | Greczkowski Roy A | $41,750 | |
| Previous Owner | Greczkowski Roy A | $121,584 | |
| Previous Owner | Greczkowski Roy A | $165,600 |
Source: Public Records
Tax History
| Year | Tax Paid | Tax Assessment Tax Assessment Total Assessment is a certain percentage of the fair market value that is determined by local assessors to be the total taxable value of land and additions on the property. | Land | Improvement |
|---|---|---|---|---|
| 2025 | $6,101 | $255,700 | $37,250 | $218,450 |
| 2024 | $5,983 | $255,700 | $37,250 | $218,450 |
| 2023 | $5,827 | $255,700 | $37,250 | $218,450 |
| 2022 | $6,237 | $171,600 | $32,150 | $139,450 |
| 2021 | $5,256 | $171,600 | $32,150 | $139,450 |
| 2020 | $5,256 | $171,600 | $32,150 | $139,450 |
| 2019 | $5,256 | $171,600 | $32,150 | $139,450 |
| 2018 | $5,193 | $171,600 | $32,150 | $139,450 |
| 2017 | $5,184 | $160,900 | $27,090 | $133,810 |
| 2016 | $5,044 | $160,900 | $27,090 | $133,810 |
| 2015 | $4,933 | $160,900 | $27,090 | $133,810 |
| 2014 | $4,933 | $160,900 | $27,090 | $133,810 |
Source: Public Records
Map
Nearby Homes
- 277 Moosup Pond Rd
- 169 Moosup Pond Rd
- 0 Green Hollow Rd
- 79 All Hallows Rd
- 101 All Hallows Rd
- 18 Bob White Way
- 13 Henry Dr
- 200 Pond Hill Rd
- 170 Putnam Rd
- 100 Squaw Rock Rd
- 99 Squaw Rock Rd
- 365-367 Putnam Rd
- 28 Walas Rd
- 58 Milner Ave
- 44-46 S Chestnut St
- 41-43 Milner Ave
- 181 Snake Meadow Rd
- 46-52 Wauregan Rd
- 30 S Walnut St
- 0 Wauregan Rd NE Unit 24143170
- 15 Juniper Ln
- 11 Juniper Ln
- 17 Juniper Ln
- 7 Juniper Ln
- 18 Juniper Ln
- 16 Juniper Ln
- 19 Juniper Ln
- 12 Juniper Ln
- 22 Juniper Ln
- 5 Juniper Ln
- 350 Green Hollow Rd
- 6 Juniper Ln
- 342 Green Hollow Rd
- 346 Green Hollow Rd
- 24 Juniper Ln
- 20 Juniper Ln
- 4 Juniper Ln
- 14 Juniper Ln
- 332 Green Hollow Rd
- 358 Green Hollow Rd
Your Personal Tour Guide
Ask me questions while you tour the home.