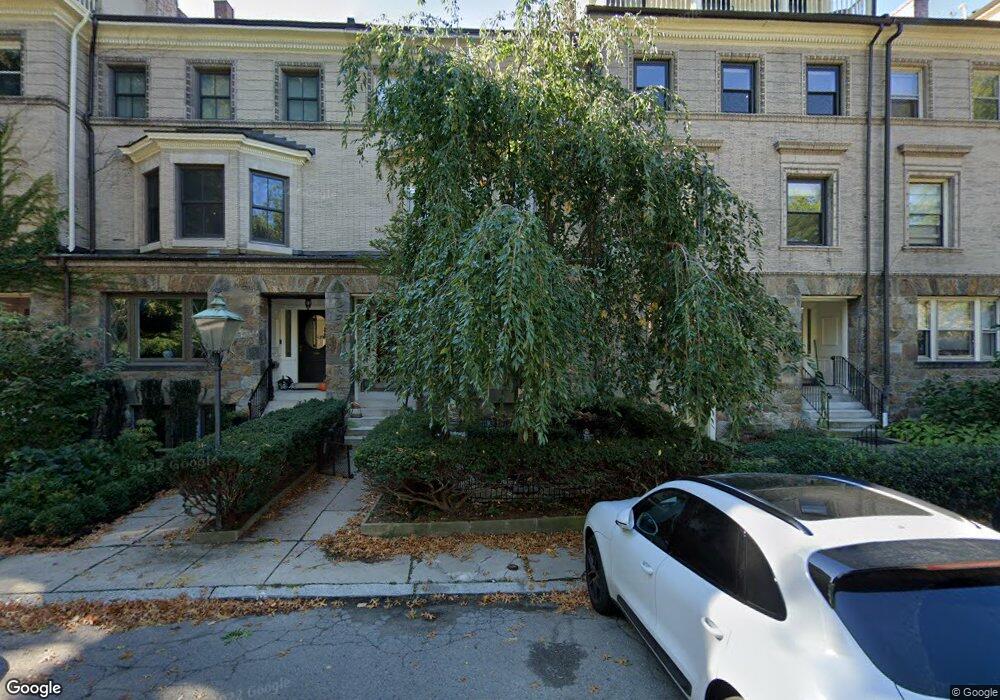
13 Regent Cir Unit 1 Brookline, MA 02445
Washington Square NeighborhoodEstimated Value: $494,227 - $574,000
1
Bed
1
Bath
658
Sq Ft
$798/Sq Ft
Est. Value
About This Home
This home is located at 13 Regent Cir Unit 1, Brookline, MA 02445 and is currently estimated at $525,057, approximately $797 per square foot. 13 Regent Cir Unit 1 is a home located in Norfolk County with nearby schools including John D. Runkle School, Brookline High School, and Torah Academy.
Ownership History
Date
Name
Owned For
Owner Type
Purchase Details
Closed on
Jul 31, 2003
Sold by
Farrell Dana
Bought by
Debiasse Michele A
Current Estimated Value
Home Financials for this Owner
Home Financials are based on the most recent Mortgage that was taken out on this home.
Original Mortgage
$200,000
Outstanding Balance
$85,888
Interest Rate
5.28%
Mortgage Type
Purchase Money Mortgage
Estimated Equity
$439,169
Purchase Details
Closed on
Jul 31, 2000
Sold by
Davis Todd
Bought by
Farrell Dana
Home Financials for this Owner
Home Financials are based on the most recent Mortgage that was taken out on this home.
Original Mortgage
$175,305
Interest Rate
8.18%
Mortgage Type
Purchase Money Mortgage
Purchase Details
Closed on
Nov 30, 1998
Sold by
August Judith
Bought by
Davis Todd
Home Financials for this Owner
Home Financials are based on the most recent Mortgage that was taken out on this home.
Original Mortgage
$135,850
Interest Rate
6.83%
Mortgage Type
Purchase Money Mortgage
Create a Home Valuation Report for This Property
The Home Valuation Report is an in-depth analysis detailing your home's value as well as a comparison with similar homes in the area
Home Values in the Area
Average Home Value in this Area
Purchase History
| Date | Buyer | Sale Price | Title Company |
|---|---|---|---|
| Debiasse Michele A | $297,000 | -- | |
| Farrell Dana | $195,000 | -- | |
| Davis Todd | $143,000 | -- |
Source: Public Records
Mortgage History
| Date | Status | Borrower | Loan Amount |
|---|---|---|---|
| Open | Debiasse Michele A | $200,000 | |
| Previous Owner | Davis Todd | $175,305 | |
| Previous Owner | Davis Todd | $135,600 | |
| Previous Owner | Davis Todd | $135,850 |
Source: Public Records
Tax History
| Year | Tax Paid | Tax Assessment Tax Assessment Total Assessment is a certain percentage of the fair market value that is determined by local assessors to be the total taxable value of land and additions on the property. | Land | Improvement |
|---|---|---|---|---|
| 2025 | $4,669 | $473,100 | $0 | $473,100 |
| 2024 | $4,531 | $463,800 | $0 | $463,800 |
| 2023 | $4,724 | $473,800 | $0 | $473,800 |
| 2022 | $4,733 | $464,500 | $0 | $464,500 |
| 2021 | $4,507 | $459,900 | $0 | $459,900 |
| 2020 | $4,304 | $455,400 | $0 | $455,400 |
| 2019 | $4,064 | $433,700 | $0 | $433,700 |
| 2018 | $3,841 | $406,000 | $0 | $406,000 |
| 2017 | $3,714 | $375,900 | $0 | $375,900 |
| 2016 | $3,561 | $341,700 | $0 | $341,700 |
| 2015 | $3,318 | $310,700 | $0 | $310,700 |
| 2014 | $3,127 | $274,500 | $0 | $274,500 |
Source: Public Records
Map
Nearby Homes
- 1731 Beacon St Unit 114
- 1731 Beacon St Unit 512
- 1731 Beacon St Unit 119
- 324 Tappan St Unit 2
- 1762 Beacon St Unit 1
- 325 Tappan St Unit 6
- 321 Tappan St Unit 3
- 184 Rawson Rd
- 4 7 Englewood Ave
- 9 Clinton Path Unit 1
- 14 Claflin Rd Unit 3
- 38 Kilsyth Rd Unit 21
- 38 Englewood Ave Unit 1
- 15 Colliston Rd Unit 6
- 90 Addington Rd Unit 1
- 90 Kilsyth Rd Unit 31
- 90 Kilsyth Rd Unit 32
- 1620 Beacon St
- 1618 Beacon St Unit A
- 48 Strathmore Rd Unit 26
- 13 Regent Cir Unit 2
- 13 Regent Cir
- 9 Regent Cir Unit 5
- 9 Regent Cir Unit 2
- 9 Regent Cir Unit One
- 9 Regent Cir Unit 3
- 9 Regent Cir Unit 1
- 9 Regent Cir Unit 4
- 9 Regent Cir
- 15 Regent Cir
- 15 Regent Cir
- 15 Regent Cir Unit A
- 15 Regent Cir Unit SF
- 15 Regent Cir Unit 2
- 15 Regent Cir Unit 1
- 11 Regent Cir Unit 5
- 11 Regent Cir Unit 4
- 11 Regent Cir Unit 3
- 11 Regent Cir Unit 2
- 11 Regent Cir Unit 1
Your Personal Tour Guide
Ask me questions while you tour the home.