
Landlord's Agent in 2023
Cheri Peterson-Dill
RE/MAX
(314) 283-7251
21 in this area
161 Total Sales
Estimated Value: $361,000 - $382,000
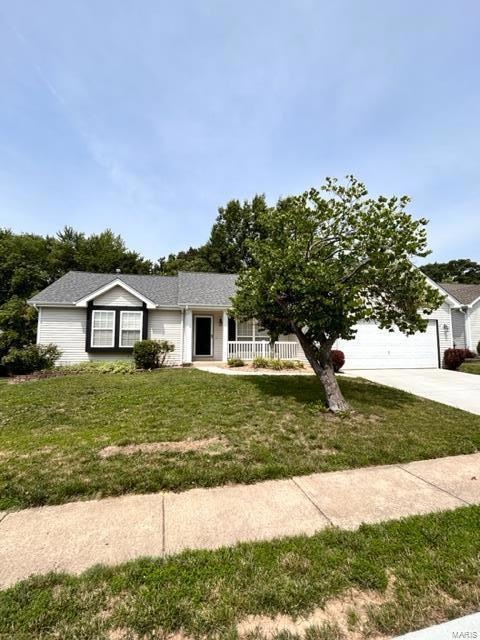
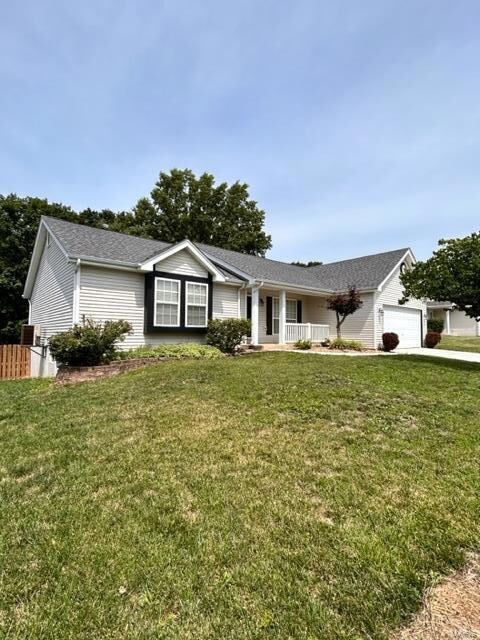
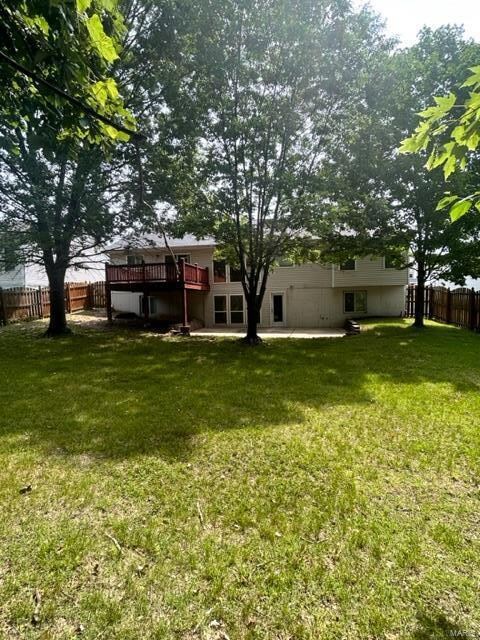
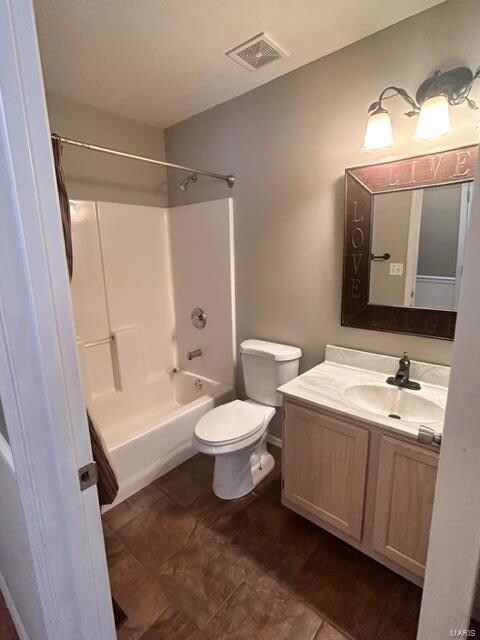
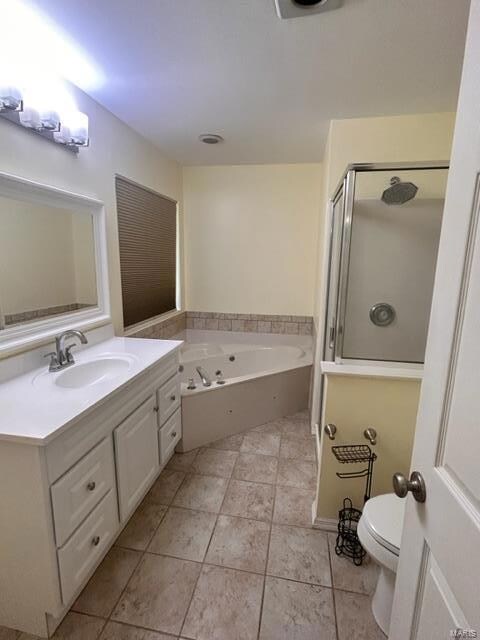
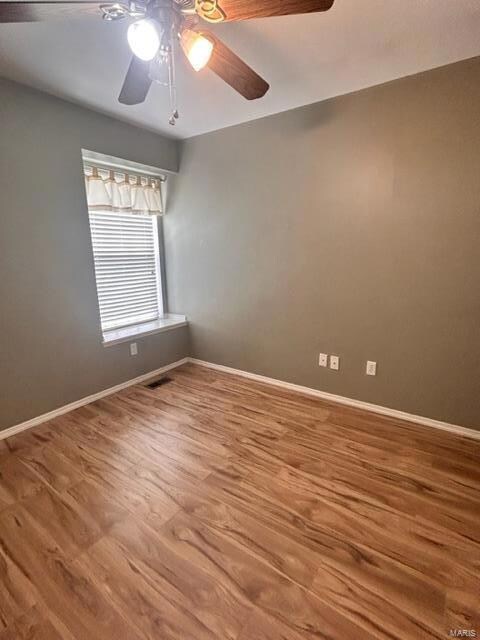
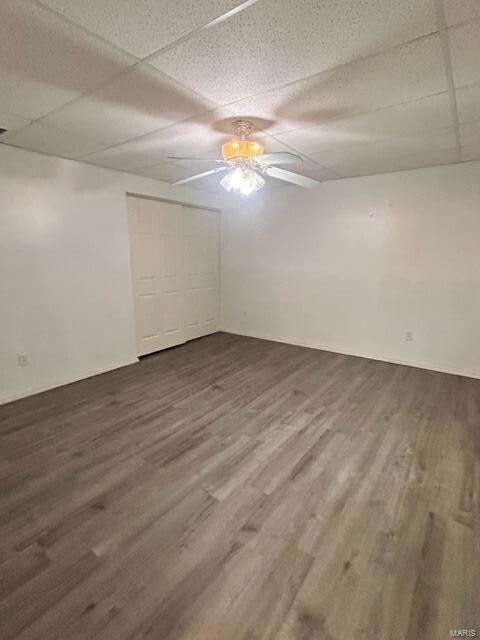
Fabulous Location Near Shops, Schools, Bank, Restaurants & More! Ready For Immediate Occupancy! Vaulted Open Floor Plan Atrium Ranch. Kitchen Features Granite Countertops, Breakfast Bar, All Appliances Included as Shown Gas Range, Built In Microwave . Main Floor Laundry w/Storage Cabinets, Walk Out Partially Finished LL w/Full Bathroom, Rec/Family Area, Additional Bedroom Area/Den. Master Bedroom has a Separate Tub & Shower, W/I Closet. The 2nd and 3rd Bedrooms offer Box Bay Windows w/Seat. Step Out Onto the Large Deck from the Breakfast Room That Overlooks the Fenced/Level Lot and Large Patio. Garage is Extra Deep on One Side. Details on how to apply can be found in agent comments. NO PETS AND NO SMOKING!!!!! Occupancy Inspection DONE! New HVAC 8/2023.
Last Agent to Rent the Property
RE/MAX EDGE License #1999090438 Listed on: 07/07/2023
| Date | Buyer | Sale Price | Title Company |
|---|---|---|---|
| Zhang Fan | -- | Title Partners Agency Llc | |
| Eilermann Ryan | -- | -- | |
| Eilermann Sharon L | $130,550 | -- |
| Date | Event | Price | List to Sale | Price per Sq Ft | Prior Sale |
|---|---|---|---|---|---|
| 09/11/2023 09/11/23 | Rented | $2,500 | 0.0% | -- | |
| 09/08/2023 09/08/23 | Under Contract | -- | -- | -- | |
| 08/07/2023 08/07/23 | Price Changed | $2,500 | -3.8% | $1 / Sq Ft | |
| 07/07/2023 07/07/23 | For Rent | $2,600 | +18.2% | -- | |
| 08/27/2021 08/27/21 | Rented | $2,200 | 0.0% | -- | |
| 08/11/2021 08/11/21 | Under Contract | -- | -- | -- | |
| 07/27/2021 07/27/21 | For Rent | $2,200 | 0.0% | -- | |
| 07/24/2021 07/24/21 | Under Contract | -- | -- | -- | |
| 07/16/2021 07/16/21 | For Rent | $2,200 | +29.4% | -- | |
| 06/05/2017 06/05/17 | Rented | $1,700 | 0.0% | -- | |
| 06/04/2017 06/04/17 | Under Contract | -- | -- | -- | |
| 06/01/2017 06/01/17 | For Rent | $1,700 | 0.0% | -- | |
| 06/01/2017 06/01/17 | Under Contract | -- | -- | -- | |
| 05/13/2017 05/13/17 | For Rent | $1,700 | 0.0% | -- | |
| 05/09/2017 05/09/17 | Under Contract | -- | -- | -- | |
| 05/06/2017 05/06/17 | For Rent | $1,700 | 0.0% | -- | |
| 04/20/2017 04/20/17 | Sold | -- | -- | -- | View Prior Sale |
| 03/27/2017 03/27/17 | Pending | -- | -- | -- | |
| 03/02/2017 03/02/17 | For Sale | $229,900 | -- | $92 / Sq Ft |
| Year | Tax Paid | Tax Assessment Tax Assessment Total Assessment is a certain percentage of the fair market value that is determined by local assessors to be the total taxable value of land and additions on the property. | Land | Improvement |
|---|---|---|---|---|
| 2025 | $3,969 | $59,862 | -- | -- |
| 2023 | $3,970 | $60,005 | $0 | $0 |
| 2022 | $3,453 | $48,504 | $0 | $0 |
| 2021 | $3,455 | $48,504 | $0 | $0 |
| 2020 | $3,205 | $43,564 | $0 | $0 |
| 2019 | $3,212 | $43,564 | $0 | $0 |
| 2018 | $2,830 | $36,608 | $0 | $0 |
| 2017 | $2,792 | $36,608 | $0 | $0 |
| 2016 | $2,550 | $33,304 | $0 | $0 |
| 2015 | $2,371 | $33,304 | $0 | $0 |
| 2014 | -- | $32,371 | $0 | $0 |
Landlord's Agent in 2023
Cheri Peterson-Dill
RE/MAX
(314) 283-7251
21 in this area
161 Total Sales
Seller's Agent in 2017
Xiangyun Xiao
Tenty Realty LLC
(858) 877-8066
4 in this area
41 Total Sales
Seller's Agent in 2017
Lisa Adkins
RE/MAX
(636) 272-4205
80 in this area
318 Total Sales
D
Buyer's Agent in 2017
Dawn Baumgartner
Agape Realty
Source: MARIS MLS
MLS Number: MIS23040320
APN: 2-0114-7879-00-0098.0000000
Disclaimer: Certain information contained herein is derived from information provided by parties other than Homes.com. All information provided is deemed reliable, but is not guaranteed to be accurate and should be independently verified.
![]() Based on information submitted to the MLS GRID. All data is obtained from various sources and may not have been verified by broker or MLS GRID. Supplied Open House Information is subject to change without notice. All information should be independently reviewed and verified for accuracy. Properties may or may not be listed by the office/agent presenting the information. Some IDX listings have been excluded from this website.
Based on information submitted to the MLS GRID. All data is obtained from various sources and may not have been verified by broker or MLS GRID. Supplied Open House Information is subject to change without notice. All information should be independently reviewed and verified for accuracy. Properties may or may not be listed by the office/agent presenting the information. Some IDX listings have been excluded from this website.
Based on information submitted to the MLS GRID
Ask me questions while you tour the home.