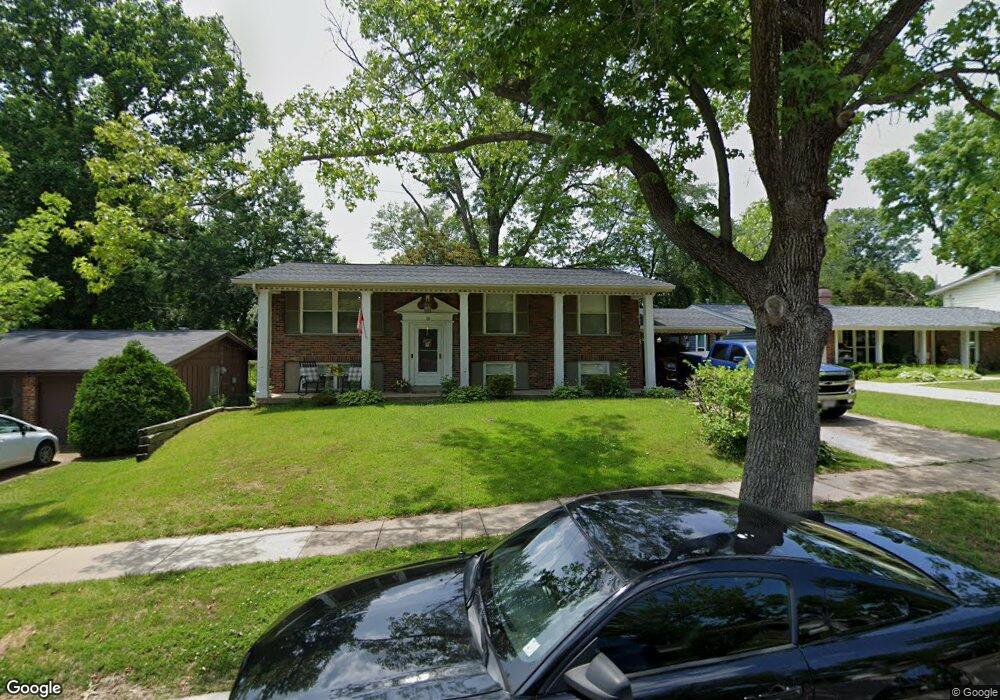
13 Timberleigh Ct Ballwin, MO 63021
Estimated Value: $279,351 - $336,000
3
Beds
2
Baths
1,066
Sq Ft
$284/Sq Ft
Est. Value
About This Home
This home is located at 13 Timberleigh Ct, Ballwin, MO 63021 and is currently estimated at $302,338, approximately $283 per square foot. 13 Timberleigh Ct is a home located in St. Louis County with nearby schools including Hanna Woods Elementary School, Parkway South Middle School, and Parkway South High School.
Ownership History
Date
Name
Owned For
Owner Type
Purchase Details
Closed on
Apr 15, 2019
Sold by
Renda Rentals Llc
Bought by
Renda Peter L and Renda Janet L
Current Estimated Value
Home Financials for this Owner
Home Financials are based on the most recent Mortgage that was taken out on this home.
Original Mortgage
$122,000
Outstanding Balance
$107,260
Interest Rate
4.3%
Mortgage Type
New Conventional
Estimated Equity
$195,078
Purchase Details
Closed on
Sep 22, 2009
Sold by
Renda Peter L and Renda Janet
Bought by
Renda Rentals Llc
Purchase Details
Closed on
Nov 7, 2003
Sold by
Welch Larry and Welch Arlene
Bought by
Renda Peter L and Renda Janet
Purchase Details
Closed on
Jun 14, 2002
Sold by
Simon Jeffrey C and Simon Susan I
Bought by
Welch Larry and Welch Arlene
Home Financials for this Owner
Home Financials are based on the most recent Mortgage that was taken out on this home.
Original Mortgage
$150,960
Interest Rate
6.82%
Mortgage Type
VA
Create a Home Valuation Report for This Property
The Home Valuation Report is an in-depth analysis detailing your home's value as well as a comparison with similar homes in the area
Home Values in the Area
Average Home Value in this Area
Purchase History
| Date | Buyer | Sale Price | Title Company |
|---|---|---|---|
| Renda Peter L | -- | Touchstone Title & Abstract | |
| Renda Rentals Llc | -- | None Available | |
| Renda Peter L | $155,000 | -- | |
| Welch Larry | $148,000 | -- |
Source: Public Records
Mortgage History
| Date | Status | Borrower | Loan Amount |
|---|---|---|---|
| Open | Renda Peter L | $122,000 | |
| Previous Owner | Welch Larry | $150,960 |
Source: Public Records
Tax History
| Year | Tax Paid | Tax Assessment Tax Assessment Total Assessment is a certain percentage of the fair market value that is determined by local assessors to be the total taxable value of land and additions on the property. | Land | Improvement |
|---|---|---|---|---|
| 2025 | $3,005 | $47,920 | $28,160 | $19,760 |
| 2024 | $3,005 | $43,680 | $21,130 | $22,550 |
| 2023 | $3,031 | $43,680 | $21,130 | $22,550 |
| 2022 | $2,861 | $37,870 | $21,130 | $16,740 |
| 2021 | $2,844 | $37,870 | $21,130 | $16,740 |
| 2020 | $2,743 | $34,940 | $17,590 | $17,350 |
| 2019 | $2,690 | $34,940 | $17,590 | $17,350 |
| 2018 | $2,444 | $29,420 | $13,210 | $16,210 |
| 2017 | $2,342 | $29,420 | $13,210 | $16,210 |
| 2016 | $2,476 | $28,930 | $10,560 | $18,370 |
Source: Public Records
Map
Nearby Homes
- 1051 Briarhurst Dr
- 908 Hanna Rd
- 821 Courtland Place
- 1131 Westleigh Terrace
- 802 Delhurst Dr
- 1226 Cottagemill Dr
- 805 Phaeton Dr
- 1211 Big Bend Rd
- 1019 Pocono Trail
- 1324 Boly Ln
- 1332 Holgate Dr Unit G5
- 836 Wheelwright Dr
- 1340 Holgate Dr Unit G3
- 1306 Tahoe Valley Ct Unit K1306
- 1323 Tahoe Valley Ct
- 1327 Holgate Dr Unit C
- 514 Meramec Station Rd
- 1344 Highland Oaks Dr Unit A
- 804 Joyceann Dr
- 846 Pheasant Woods Dr
- 14 Timberleigh Ct
- 12 Timberleigh Ct
- 15 Timberleigh Ct
- 11 Timberleigh Ct
- 916 Sherwick Terrace
- 914 Sherwick Terrace
- 6 Timberleigh Ct
- 5 Timberleigh Ct
- 912 Sherwick Terrace
- 918 Sherwick Terrace
- 16 Timberleigh Ct
- 7 Timberleigh Ct
- 4 Timberleigh Ct
- 10 Timberleigh Ct
- 910 Sherwick Terrace
- 17 Timberleigh Ct
- 8 Timberleigh Ct
- 9 Timberleigh Ct
- 3 Timberleigh Ct
- 908 Sherwick Terrace
Your Personal Tour Guide
Ask me questions while you tour the home.