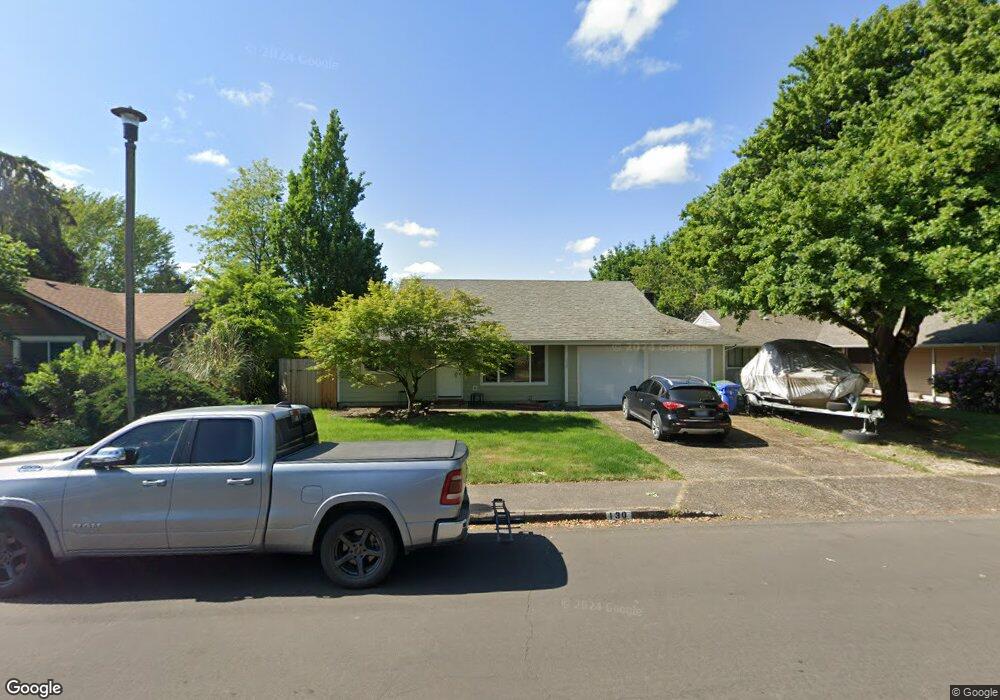
130 Lynnbrook Dr Eugene, OR 97404
Santa Clara NeighborhoodEstimated Value: $391,000 - $429,000
3
Beds
2
Baths
1,212
Sq Ft
$335/Sq Ft
Est. Value
About This Home
This home is located at 130 Lynnbrook Dr, Eugene, OR 97404 and is currently estimated at $406,618, approximately $335 per square foot. 130 Lynnbrook Dr is a home located in Lane County with nearby schools including Spring Creek Elementary School, Madison Middle School, and North Eugene High School.
Ownership History
Date
Name
Owned For
Owner Type
Purchase Details
Closed on
Oct 31, 2012
Sold by
Westfall Joshua Ryan and Sobczak Alicia Kay
Bought by
Westfall Joshua Ryan and Westfall Alicia Kay
Current Estimated Value
Home Financials for this Owner
Home Financials are based on the most recent Mortgage that was taken out on this home.
Original Mortgage
$190,000
Outstanding Balance
$130,163
Interest Rate
3.36%
Mortgage Type
New Conventional
Estimated Equity
$276,455
Purchase Details
Closed on
Dec 31, 2007
Sold by
Call Colin M and Call Angela E
Bought by
Westfall Joshua Ryan and Sobczak Alicia Kay
Home Financials for this Owner
Home Financials are based on the most recent Mortgage that was taken out on this home.
Original Mortgage
$199,000
Interest Rate
6.15%
Mortgage Type
Purchase Money Mortgage
Create a Home Valuation Report for This Property
The Home Valuation Report is an in-depth analysis detailing your home's value as well as a comparison with similar homes in the area
Home Values in the Area
Average Home Value in this Area
Purchase History
| Date | Buyer | Sale Price | Title Company |
|---|---|---|---|
| Westfall Joshua Ryan | -- | Firstclose Title Llc | |
| Westfall Joshua Ryan | $199,000 | First American Title |
Source: Public Records
Mortgage History
| Date | Status | Borrower | Loan Amount |
|---|---|---|---|
| Open | Westfall Joshua Ryan | $190,000 | |
| Closed | Westfall Joshua Ryan | $199,000 |
Source: Public Records
Tax History
| Year | Tax Paid | Tax Assessment Tax Assessment Total Assessment is a certain percentage of the fair market value that is determined by local assessors to be the total taxable value of land and additions on the property. | Land | Improvement |
|---|---|---|---|---|
| 2025 | $2,877 | $224,774 | -- | -- |
| 2024 | $2,862 | $218,228 | -- | -- |
| 2023 | $2,862 | $211,872 | $0 | $0 |
| 2022 | $2,690 | $205,701 | $0 | $0 |
| 2021 | $2,468 | $199,710 | $0 | $0 |
| 2020 | $2,514 | $193,894 | $0 | $0 |
| 2019 | $2,419 | $188,247 | $0 | $0 |
| 2018 | $2,189 | $177,442 | $0 | $0 |
| 2017 | $1,998 | $177,442 | $0 | $0 |
| 2016 | $1,872 | $172,274 | $0 | $0 |
| 2015 | $1,795 | $167,256 | $0 | $0 |
| 2014 | $1,679 | $162,384 | $0 | $0 |
Source: Public Records
Map
Nearby Homes
- 212 Chimney Rock Ln
- 709 Tyson Ln
- 591 Argon Ave
- 47 van Fossen Ct
- 4490 Doyle St
- 3985 Shenstone Dr
- 4278 Torrington Ave
- 420 Lynnbrook Dr
- 4366 Berry Ln
- 1133 Irvington Dr
- 110 Calumet Ave
- 4471 Spring Meadow Ave
- 374 Blackfoot Ave
- 329 Dean Ave
- 579 Sweetwater Ln
- 4483 Thunderbird St
- 355 River Loop 2
- 3256 Marvin Dr
- 90 Daniel Dr
- 4795 Thunderbird St
- 132 Lynnbrook Dr
- 128 Lynnbrook Dr
- 126 Lynnbrook Dr
- 134 Lynnbrook Dr
- 415 Naismith Blvd
- 403 Naismith Blvd
- 423 Naismith Blvd
- 122 Lynnbrook Dr
- 136 Lynnbrook Dr
- 125 Lynnbrook Dr
- 121 Lynnbrook Dr
- 429 Naismith Blvd
- 397 Naismith Blvd
- 131 Lynnbrook Dr
- 115 Lynnbrook Dr
- 138 Lynnbrook Dr
- 118 Lynnbrook Dr
- 385 Naismith Blvd
- 135 Lynnbrook Dr
- 4004 Victoria Ln
Your Personal Tour Guide
Ask me questions while you tour the home.