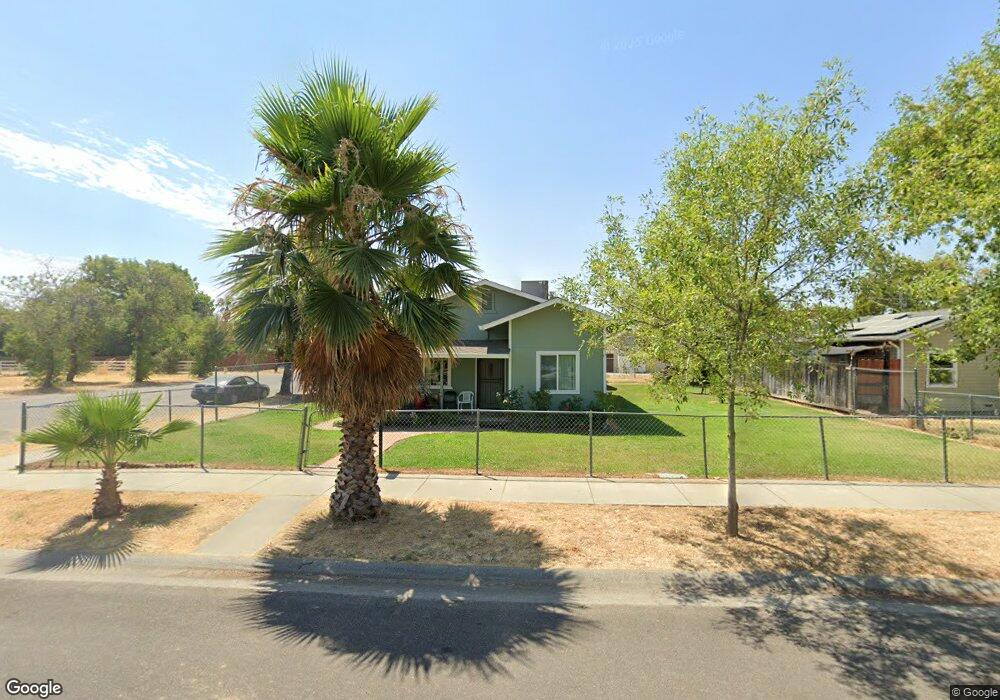
1301 Colusa St Corning, CA 96021
Estimated Value: $223,000 - $262,000
2
Beds
1
Bath
844
Sq Ft
$282/Sq Ft
Est. Value
About This Home
This home is located at 1301 Colusa St, Corning, CA 96021 and is currently estimated at $238,157, approximately $282 per square foot. 1301 Colusa St is a home located in Tehama County with nearby schools including Woodson Elementary School, Maywood Middle School, and Corning High School.
Ownership History
Date
Name
Owned For
Owner Type
Purchase Details
Closed on
Oct 29, 2021
Sold by
Hernandez Francisca and Hernandez Miguel Angel
Bought by
Hernandez Miguel Angel
Current Estimated Value
Purchase Details
Closed on
Jul 11, 2019
Sold by
Hernandez Francisca
Bought by
Hernandez Francisca and Hernandez Miguel Angel
Purchase Details
Closed on
Sep 22, 2010
Sold by
Hernandez Luis and Barriga Marcelina
Bought by
Hernandez Francisca
Create a Home Valuation Report for This Property
The Home Valuation Report is an in-depth analysis detailing your home's value as well as a comparison with similar homes in the area
Home Values in the Area
Average Home Value in this Area
Purchase History
| Date | Buyer | Sale Price | Title Company |
|---|---|---|---|
| Hernandez Miguel Angel | -- | None Available | |
| Hernandez Francisca | -- | None Available | |
| Hernandez Francisca | -- | None Available |
Source: Public Records
Tax History Compared to Growth
Tax History
| Year | Tax Paid | Tax Assessment Tax Assessment Total Assessment is a certain percentage of the fair market value that is determined by local assessors to be the total taxable value of land and additions on the property. | Land | Improvement |
|---|---|---|---|---|
| 2025 | $2,189 | $212,241 | $53,060 | $159,181 |
| 2023 | $2,148 | $204,000 | $51,000 | $153,000 |
| 2022 | $2,118 | $200,000 | $50,000 | $150,000 |
| 2021 | $533 | $57,769 | $25,990 | $31,779 |
| 2020 | $538 | $57,178 | $25,724 | $31,454 |
| 2019 | $515 | $56,058 | $25,220 | $30,838 |
| 2018 | $514 | $54,960 | $24,726 | $30,234 |
| 2017 | $509 | $53,884 | $24,242 | $29,642 |
| 2016 | $474 | $52,828 | $23,767 | $29,061 |
| 2015 | $470 | $52,035 | $23,410 | $28,625 |
| 2014 | $460 | $51,017 | $22,952 | $28,065 |
Source: Public Records
Map
Nearby Homes