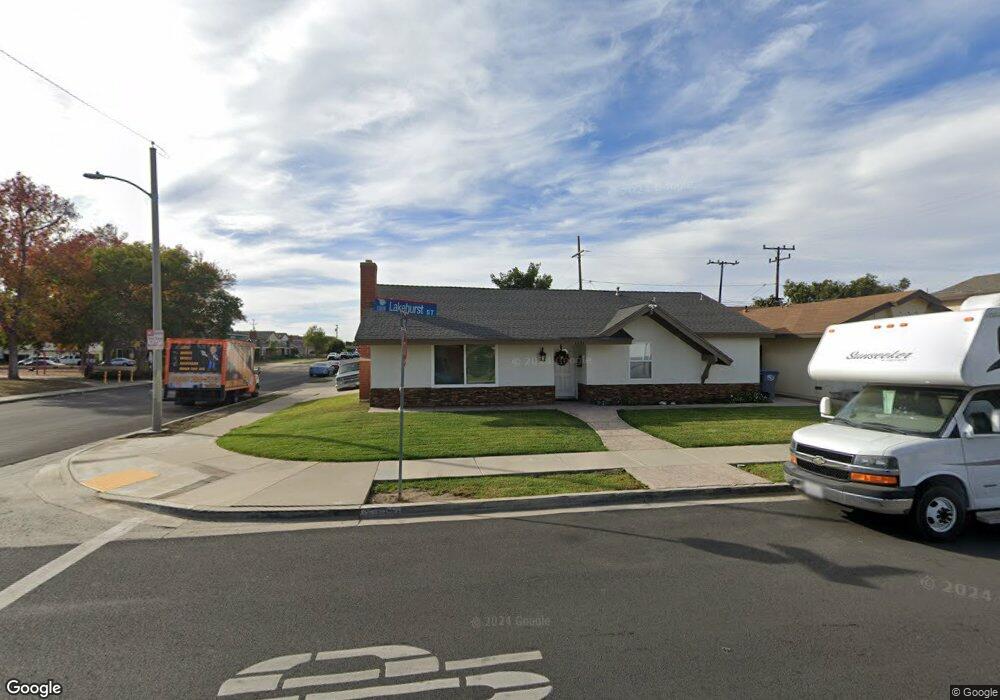
1301 Lakehurst St Oxnard, CA 93030
Fremont North NeighborhoodEstimated Value: $786,614 - $814,000
3
Beds
3
Baths
1,618
Sq Ft
$497/Sq Ft
Est. Value
About This Home
This home is located at 1301 Lakehurst St, Oxnard, CA 93030 and is currently estimated at $804,154, approximately $497 per square foot. 1301 Lakehurst St is a home located in Ventura County with nearby schools including Sierra Linda Elementary School, Pacifica High School, and Santa Clara Elementary School.
Ownership History
Date
Name
Owned For
Owner Type
Purchase Details
Closed on
May 13, 2015
Sold by
Mendez Joel and Mendez Consuelo
Bought by
Mendez Joel and Alfaro Eliana
Current Estimated Value
Home Financials for this Owner
Home Financials are based on the most recent Mortgage that was taken out on this home.
Original Mortgage
$300,000
Outstanding Balance
$230,689
Interest Rate
3.63%
Mortgage Type
New Conventional
Estimated Equity
$573,465
Purchase Details
Closed on
Mar 8, 2010
Sold by
Macteam Investments Inc
Bought by
Mendez Joel and Mendez Consuelo
Home Financials for this Owner
Home Financials are based on the most recent Mortgage that was taken out on this home.
Original Mortgage
$264,000
Interest Rate
4.93%
Mortgage Type
New Conventional
Purchase Details
Closed on
Oct 13, 2009
Sold by
Citibank Na
Bought by
Mac Team Investments Inc
Purchase Details
Closed on
Aug 26, 2009
Sold by
Carmona Daniel and Carmona Sandra Y
Bought by
Citibank Na
Create a Home Valuation Report for This Property
The Home Valuation Report is an in-depth analysis detailing your home's value as well as a comparison with similar homes in the area
Home Values in the Area
Average Home Value in this Area
Purchase History
| Date | Buyer | Sale Price | Title Company |
|---|---|---|---|
| Mendez Joel | $200,000 | Stewart Title | |
| Mendez Joel | $330,000 | Chicago Title Company | |
| Mac Team Investments Inc | $240,000 | Chicago Title Company | |
| Citibank Na | $269,185 | Servicelink |
Source: Public Records
Mortgage History
| Date | Status | Borrower | Loan Amount |
|---|---|---|---|
| Open | Mendez Joel | $300,000 | |
| Closed | Mendez Joel | $264,000 |
Source: Public Records
Tax History Compared to Growth
Tax History
| Year | Tax Paid | Tax Assessment Tax Assessment Total Assessment is a certain percentage of the fair market value that is determined by local assessors to be the total taxable value of land and additions on the property. | Land | Improvement |
|---|---|---|---|---|
| 2025 | $5,819 | $478,500 | $289,731 | $188,769 |
| 2024 | $5,819 | $469,118 | $284,050 | $185,068 |
| 2023 | $5,607 | $459,920 | $278,480 | $181,440 |
| 2022 | $5,438 | $450,902 | $273,019 | $177,883 |
| 2021 | $5,395 | $442,061 | $267,665 | $174,396 |
| 2020 | $5,495 | $437,529 | $264,921 | $172,608 |
| 2019 | $5,340 | $428,951 | $259,727 | $169,224 |
| 2018 | $5,266 | $420,541 | $254,635 | $165,906 |
| 2017 | $4,998 | $412,296 | $249,643 | $162,653 |
| 2016 | $4,824 | $404,213 | $244,749 | $159,464 |
| 2015 | $4,345 | $354,424 | $177,212 | $177,212 |
| 2014 | -- | $347,484 | $173,742 | $173,742 |
Source: Public Records
Map
Nearby Homes
- 1340 Huntswood Way
- 1337 Edgewood Way Unit 37
- 1349 Edgewood Way Unit 49
- 1363 Edgewood Way Unit 63
- 931 Nottingham Dr
- 1630 Patricia St
- 1127 Douglas Ave
- 1920 N H St Unit 235
- 1920 N H St Unit 251
- 1911 Bernadette St
- 620 W Gonzales Rd Unit D
- 620 W Gonzales Rd Unit C
- 620 W Gonzales Rd Unit B
- 620 W Gonzales Rd Unit A
- 620 W Gonzales Rd
- 2020 Ironbark Dr
- 521 Glenwood Dr
- 1950 Devonshire Dr
- 550 Lawnwood Way
- 560 W Gonzales Rd
- 1311 Lakehurst St
- 1310 N M St
- 1320 N M St
- 1321 Lakehurst St
- 1141 Glenwood Dr
- 1330 N M St
- 1331 Lakehurst St
- 1140 Huntswood Way
- 1131 Glenwood Dr
- 1340 N M St
- 1401 Lakehurst St
- 1130 Huntswood Way
- 1301 Glenwood Dr Unit 3
- 1301 Glenwood Dr Unit C
- 1301 Glenwood Dr
- 1400 N M St
- 1121 Glenwood Dr
- 1300 Huntswood Way
- 1300 Glenwood Dr
- 1120 Huntswood Way