Estimated Value: $470,962 - $561,000
3
Beds
2
Baths
1,520
Sq Ft
$342/Sq Ft
Est. Value
About This Home
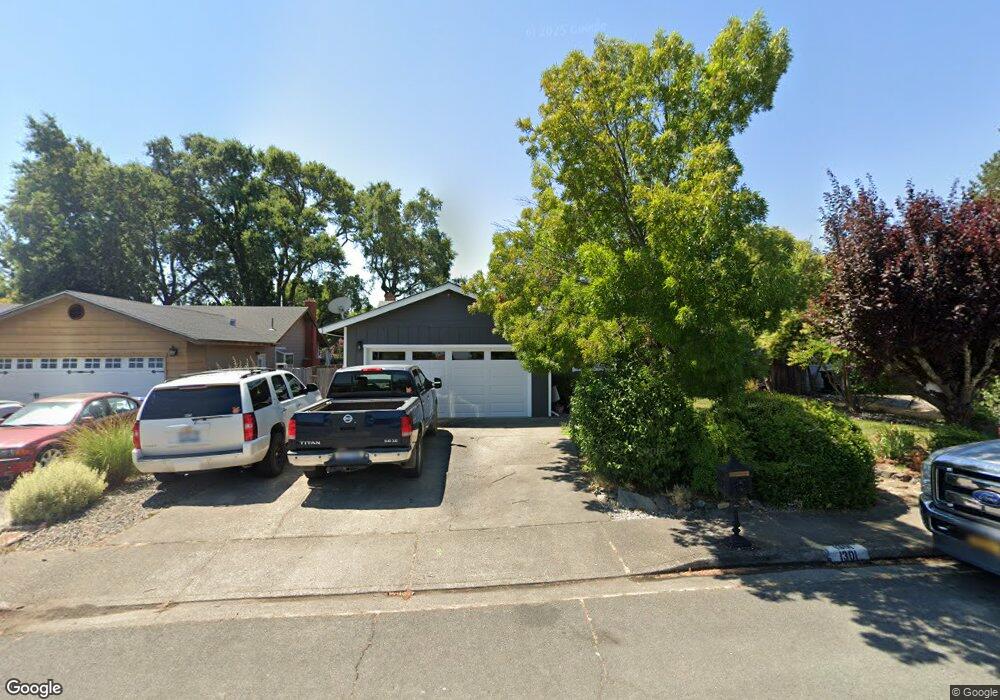
This home is located at 1301 Sirah Ct, Ukiah, CA 95482 and is currently estimated at $520,491, approximately $342 per square foot. 1301 Sirah Ct is a home located in Mendocino County with nearby schools including Frank Zeek Elementary School, Pomolita Middle School, and Ukiah High School.
Ownership History
Date
Name
Owned For
Owner Type
Purchase Details
Closed on
Feb 16, 2015
Sold by
Olson Pamela G
Bought by
Morris Bryan C and Morris Rebekah A
Current Estimated Value
Home Financials for this Owner
Home Financials are based on the most recent Mortgage that was taken out on this home.
Original Mortgage
$266,000
Outstanding Balance
$202,981
Interest Rate
3.66%
Mortgage Type
New Conventional
Estimated Equity
$317,510
Purchase Details
Closed on
Jan 10, 2003
Sold by
Webber Arliss Y
Bought by
Webber Arliss Y
Purchase Details
Closed on
Mar 18, 2002
Sold by
Smith Donald A
Bought by
Webber George D and Webber Arliss Y
Create a Home Valuation Report for This Property
The Home Valuation Report is an in-depth analysis detailing your home's value as well as a comparison with similar homes in the area
Home Values in the Area
Average Home Value in this Area
Purchase History
| Date | Buyer | Sale Price | Title Company |
|---|---|---|---|
| Morris Bryan C | $280,000 | Redwood Empire Title | |
| Webber Arliss Y | -- | -- | |
| Webber Arliss Y | -- | -- | |
| Webber George D | $280,000 | First American Title |
Source: Public Records
Mortgage History
| Date | Status | Borrower | Loan Amount |
|---|---|---|---|
| Open | Morris Bryan C | $266,000 |
Source: Public Records
Tax History Compared to Growth
Tax History
| Year | Tax Paid | Tax Assessment Tax Assessment Total Assessment is a certain percentage of the fair market value that is determined by local assessors to be the total taxable value of land and additions on the property. | Land | Improvement |
|---|---|---|---|---|
| 2025 | $4,544 | $387,584 | $108,161 | $279,423 |
| 2023 | $4,544 | $372,536 | $103,962 | $268,574 |
| 2022 | $4,351 | $365,232 | $101,924 | $263,308 |
| 2021 | $4,371 | $358,072 | $99,926 | $258,146 |
| 2020 | $4,310 | $354,402 | $98,903 | $255,499 |
| 2019 | $4,073 | $347,455 | $96,964 | $250,491 |
| 2018 | $3,974 | $340,643 | $95,063 | $245,580 |
| 2017 | $3,910 | $333,965 | $93,200 | $240,765 |
| 2016 | $3,795 | $327,419 | $91,373 | $236,046 |
| 2015 | $4,095 | $344,165 | $86,041 | $258,124 |
| 2014 | $3,923 | $337,425 | $84,356 | $253,069 |
Source: Public Records
Map
Nearby Homes