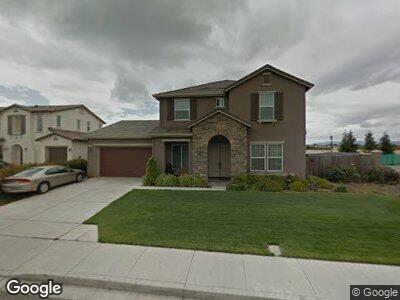
1301 Tuolumne Way Oakley, CA 94561
South Oakley NeighborhoodEstimated Value: $815,000 - $875,000
4
Beds
3
Baths
2,817
Sq Ft
$297/Sq Ft
Est. Value
About This Home
This home is located at 1301 Tuolumne Way, Oakley, CA 94561 and is currently estimated at $836,278, approximately $296 per square foot. 1301 Tuolumne Way is a home located in Contra Costa County with nearby schools including Gehringer Elementary School, Delta Vista Middle School, and Freedom High School.
Ownership History
Date
Name
Owned For
Owner Type
Purchase Details
Closed on
Aug 13, 2021
Sold by
Demanuel Armina and Demanuel Arnel
Bought by
Demanuel Armina and Demanuel Arnel
Current Estimated Value
Home Financials for this Owner
Home Financials are based on the most recent Mortgage that was taken out on this home.
Original Mortgage
$480,000
Outstanding Balance
$444,855
Interest Rate
2.9%
Mortgage Type
New Conventional
Estimated Equity
$376,030
Purchase Details
Closed on
Jul 8, 2010
Sold by
Demanuel Arnel and Demanuel Armina
Bought by
Demanuel Arnel and Demanuel Armina
Purchase Details
Closed on
May 10, 2006
Sold by
The Teton Group L P
Bought by
Demanuel Arnel and Demanuel Armind
Home Financials for this Owner
Home Financials are based on the most recent Mortgage that was taken out on this home.
Original Mortgage
$552,100
Interest Rate
1.75%
Mortgage Type
Purchase Money Mortgage
Create a Home Valuation Report for This Property
The Home Valuation Report is an in-depth analysis detailing your home's value as well as a comparison with similar homes in the area
Home Values in the Area
Average Home Value in this Area
Purchase History
| Date | Buyer | Sale Price | Title Company |
|---|---|---|---|
| Demanuel Armina | -- | Old Republic Title Company | |
| Demanuel Arnel | -- | First American Title New Hom | |
| Demanuel Arnel | $690,500 | First American Title Co |
Source: Public Records
Mortgage History
| Date | Status | Borrower | Loan Amount |
|---|---|---|---|
| Open | Demanuel Armina | $480,000 | |
| Closed | Demanuel Arnel | $552,100 |
Source: Public Records
Tax History Compared to Growth
Tax History
| Year | Tax Paid | Tax Assessment Tax Assessment Total Assessment is a certain percentage of the fair market value that is determined by local assessors to be the total taxable value of land and additions on the property. | Land | Improvement |
|---|---|---|---|---|
| 2024 | $11,508 | $808,000 | $263,436 | $544,564 |
| 2023 | $11,508 | $767,500 | $250,232 | $517,268 |
| 2022 | $11,477 | $767,500 | $250,232 | $517,268 |
| 2021 | $9,320 | $581,500 | $189,589 | $391,911 |
| 2019 | $8,485 | $526,000 | $171,495 | $354,505 |
| 2018 | $8,281 | $521,500 | $170,028 | $351,472 |
| 2017 | $7,817 | $484,500 | $157,965 | $326,535 |
| 2016 | $6,859 | $424,000 | $138,240 | $285,760 |
| 2015 | $6,409 | $376,000 | $122,590 | $253,410 |
| 2014 | $6,132 | $365,000 | $119,004 | $245,996 |
Source: Public Records
Map
Nearby Homes
- 1349 Yosemite Cir
- 121 Amador Ct
- 520 Mockingbird Ln
- 812 Hardcastle Rd
- 2119 Meadowlark Ln
- 17 Lowell Ct
- 640 Mockingbird Ln
- 1185 Quail Valley Run
- 1124 Donatello Way
- 199 Century Way
- 4867 Big Bear Rd
- 152 Hill Ave
- 14 Renoir Ct
- 15 Renoir Ct
- 4795 Mammouth Ln
- 663 Channel Cir
- 651 Channel Cir
- 655 Channel Cir
- 667 Channel Cir
- 671 Channel Cir
- 1301 Tuolumne Way
- 1303 Tuolumne Way
- 10 Minaret Rd
- 1305 Tuolumne Way
- 1302 Tuolumne Way
- 1304 Tuolumne Way
- 1207 Sierra Trail Rd
- 1300 Tuolumne Way
- 102 Heavenly Way
- 104 Heavenly Way
- 1306 Tuolumne Way
- 100 Heavenly Way
- 106 Heavenly Way
- 1408 Yosemite Cir
- 1410 Yosemite Cir
- 1406 Yosemite Cir
- 1308 Tuolumne Way
- 1412 Yosemite Cir
- 1404 Yosemite Cir
- 14 Minaret Rd