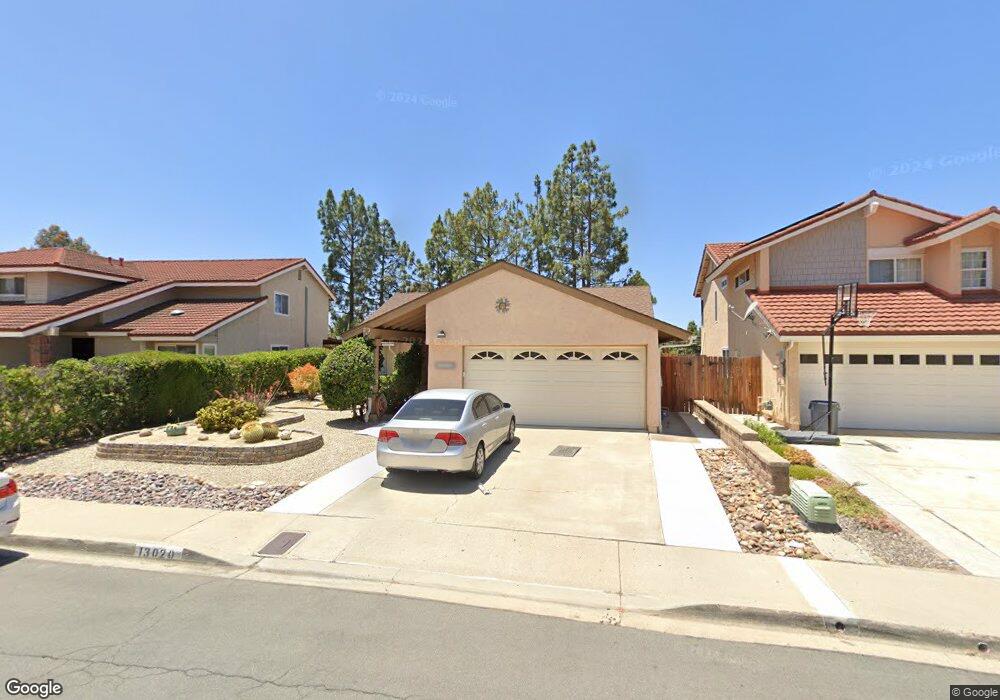
13020 Trigger St San Diego, CA 92129
Rancho Peñasquitos NeighborhoodEstimated Value: $1,160,858 - $1,365,000
3
Beds
2
Baths
1,419
Sq Ft
$887/Sq Ft
Est. Value
About This Home
This home is located at 13020 Trigger St, San Diego, CA 92129 and is currently estimated at $1,258,715, approximately $887 per square foot. 13020 Trigger St is a home located in San Diego County with nearby schools including Sundance Elementary School, Mesa Verde Middle School, and Westview High School.
Ownership History
Date
Name
Owned For
Owner Type
Purchase Details
Closed on
Dec 21, 2015
Sold by
Patrolia David J and Wong Betty
Bought by
The Patrolia Wong Family Trust and Wong Betty
Current Estimated Value
Purchase Details
Closed on
Oct 28, 2015
Sold by
Folberg David S and Folberg Donna K
Bought by
Patrolia David J and Wong Betty
Purchase Details
Closed on
Dec 30, 2001
Sold by
Ferrell Tracy A
Bought by
Folberg David S and Folberg Donna K
Home Financials for this Owner
Home Financials are based on the most recent Mortgage that was taken out on this home.
Original Mortgage
$247,500
Interest Rate
7.17%
Purchase Details
Closed on
Jul 13, 1993
Sold by
Vinck Luis A and Vinck Ellen M
Bought by
Ferrell Tracy A
Home Financials for this Owner
Home Financials are based on the most recent Mortgage that was taken out on this home.
Original Mortgage
$162,207
Interest Rate
7.2%
Mortgage Type
VA
Purchase Details
Closed on
Aug 9, 1983
Create a Home Valuation Report for This Property
The Home Valuation Report is an in-depth analysis detailing your home's value as well as a comparison with similar homes in the area
Home Values in the Area
Average Home Value in this Area
Purchase History
| Date | Buyer | Sale Price | Title Company |
|---|---|---|---|
| The Patrolia Wong Family Trust | -- | None Available | |
| Patrolia David J | $558,000 | Fidelity National Title | |
| Folberg David S | $275,000 | United Title Company | |
| Ferrell Tracy A | $176,000 | Southland Title Corporation | |
| -- | $116,000 | -- |
Source: Public Records
Mortgage History
| Date | Status | Borrower | Loan Amount |
|---|---|---|---|
| Previous Owner | Folberg David S | $247,500 | |
| Previous Owner | Ferrell Tracy A | $162,207 |
Source: Public Records
Tax History Compared to Growth
Tax History
| Year | Tax Paid | Tax Assessment Tax Assessment Total Assessment is a certain percentage of the fair market value that is determined by local assessors to be the total taxable value of land and additions on the property. | Land | Improvement |
|---|---|---|---|---|
| 2025 | $7,141 | $660,503 | $288,218 | $372,285 |
| 2024 | $7,141 | $647,553 | $282,567 | $364,986 |
| 2023 | $6,982 | $634,857 | $277,027 | $357,830 |
| 2022 | $6,840 | $622,410 | $271,596 | $350,814 |
| 2021 | $6,745 | $610,207 | $266,271 | $343,936 |
| 2020 | $6,666 | $603,951 | $263,541 | $340,410 |
| 2019 | $6,533 | $592,110 | $258,374 | $333,736 |
| 2018 | $6,394 | $580,501 | $253,308 | $327,193 |
| 2017 | $6,222 | $569,120 | $248,342 | $320,778 |
| 2016 | $6,080 | $557,962 | $243,473 | $314,489 |
| 2015 | $3,627 | $338,018 | $147,498 | $190,520 |
| 2014 | $3,540 | $331,397 | $144,609 | $186,788 |
Source: Public Records
Map
Nearby Homes
- 12880 War Horse St
- 8754 Park Run Rd
- 8672 Creekwood Ln
- 13146 Thunderhead St
- 12740 Prairie Dog Ave
- 8695 Rideabout Ln
- 12537 Ginger Snap Ct
- 12573 Brickellia St
- 12518 Darkwood Rd
- 12776 Isocoma St Unit 4
- 9342 Twin Trails Dr Unit 303
- 9012 Buckwheat St
- 9302 Twin Trails Dr Unit 204
- 9068 Buckwheat St
- 9446 Pipilo St
- 12465 Pathos Ln
- 9458 Twin Trails Dr Unit 205
- 12485 Picrus St
- 8730 Twin Trails Dr
- 9525 Vervain St
- 13016 Trigger St
- 13026 Trigger St Unit 4
- 13012 Trigger St
- 13032 Trigger St
- 13013 War Bonnet St
- 13019 War Bonnet St
- 13025 War Bonnet St
- 13009 War Bonnet St
- 13038 Trigger St
- 13025 Trigger St
- 13031 War Bonnet St
- 13008 Trigger St
- 13031 Trigger St
- 13019 Trigger St
- 13037 War Bonnet St
- 13042 Trigger St
- 13013 Trigger St
- 13004 Trigger St
- 13005 War Bonnet St
- 13043 War Bonnet St