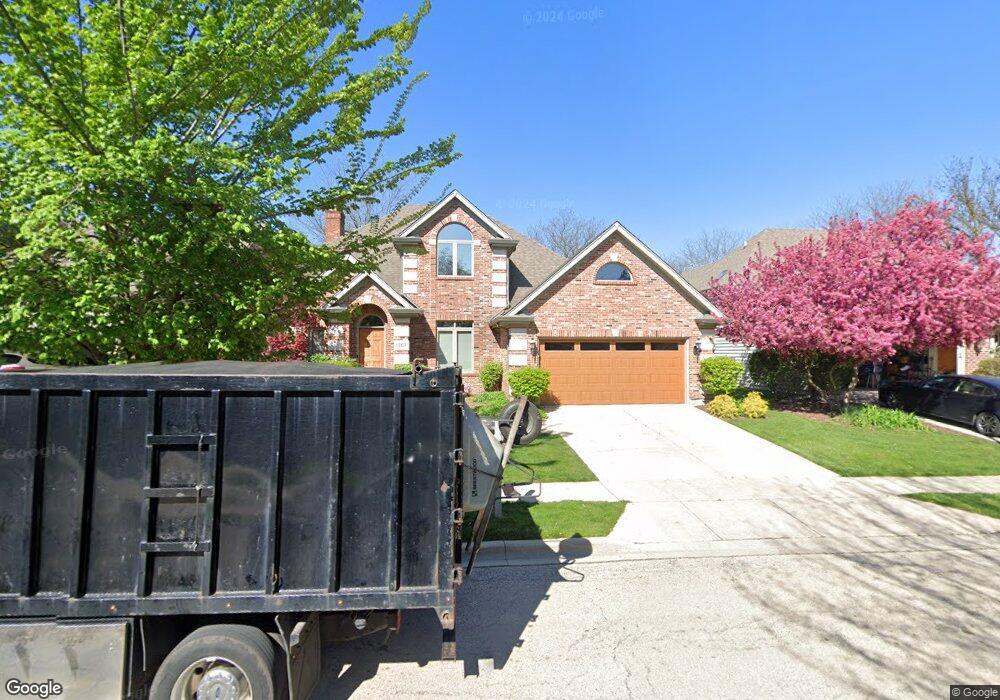
1307 Cranbrook Cir Aurora, IL 60502
Eola Yards NeighborhoodEstimated Value: $586,000 - $720,000
3
Beds
5
Baths
2,650
Sq Ft
$255/Sq Ft
Est. Value
About This Home
This home is located at 1307 Cranbrook Cir, Aurora, IL 60502 and is currently estimated at $675,514, approximately $254 per square foot. 1307 Cranbrook Cir is a home located in DuPage County with nearby schools including Gwendolyn Brooks Elementary School, Francis Granger Middle School, and Metea Valley High School.
Ownership History
Date
Name
Owned For
Owner Type
Purchase Details
Closed on
Jun 21, 2021
Sold by
Zaeske Jane and The Jane Zaeske Declaration Of
Bought by
Oreilly John F
Current Estimated Value
Home Financials for this Owner
Home Financials are based on the most recent Mortgage that was taken out on this home.
Original Mortgage
$378,000
Outstanding Balance
$342,232
Interest Rate
2.9%
Mortgage Type
New Conventional
Estimated Equity
$333,282
Purchase Details
Closed on
Aug 31, 2018
Sold by
Zaeske E Fredric and The E Fredric Zaeske Declarati
Bought by
Zaeske Jane and The Jane Zaeske Declaration Of Trust
Purchase Details
Closed on
Feb 6, 2004
Sold by
Nargie Rozanne and Rozanne Nargie Trust
Bought by
Zaesxe E Fredric and Mary K Zaesxe Family Trust
Purchase Details
Closed on
Apr 2, 1998
Sold by
Nargie Gene Roy and Nargie Rozanne Marie
Bought by
Nargie Rozanne and Nargie Gene
Create a Home Valuation Report for This Property
The Home Valuation Report is an in-depth analysis detailing your home's value as well as a comparison with similar homes in the area
Home Values in the Area
Average Home Value in this Area
Purchase History
| Date | Buyer | Sale Price | Title Company |
|---|---|---|---|
| Oreilly John F | $478,000 | Snp Title Co | |
| Zaeske Jane | -- | Attorney | |
| Zaeske E Fredric | -- | Attorney | |
| Zaesxe E Fredric | $460,000 | Multiple | |
| Nargie Rozanne | -- | -- |
Source: Public Records
Mortgage History
| Date | Status | Borrower | Loan Amount |
|---|---|---|---|
| Open | Oreilly John F | $378,000 |
Source: Public Records
Tax History
| Year | Tax Paid | Tax Assessment Tax Assessment Total Assessment is a certain percentage of the fair market value that is determined by local assessors to be the total taxable value of land and additions on the property. | Land | Improvement |
|---|---|---|---|---|
| 2024 | $14,447 | $198,007 | $76,022 | $121,985 |
| 2023 | $13,809 | $177,920 | $68,310 | $109,610 |
| 2022 | $13,016 | $161,210 | $61,480 | $99,730 |
| 2021 | $12,255 | $155,460 | $59,290 | $96,170 |
| 2020 | $12,405 | $155,460 | $59,290 | $96,170 |
| 2019 | $11,956 | $147,860 | $56,390 | $91,470 |
| 2018 | $12,918 | $157,260 | $58,800 | $98,460 |
| 2017 | $12,698 | $151,930 | $56,810 | $95,120 |
| 2016 | $12,465 | $145,810 | $54,520 | $91,290 |
| 2015 | $12,328 | $138,450 | $51,770 | $86,680 |
| 2014 | $12,948 | $140,960 | $52,370 | $88,590 |
| 2013 | $12,815 | $141,930 | $52,730 | $89,200 |
Source: Public Records
Map
Nearby Homes
- 1283 Cranbrook Cir Unit 38
- 2783 Palm Springs Ln
- 1223 Townes Cir Unit 48
- 1740 Stable Ln
- 2428 Ridgewood Ct
- 1110 Oakhill Dr
- 2762 Shetland Ln
- 322 4th St
- 970 Waterside Ct
- 1600 Harris Dr
- 3161 Hopewell Dr
- 2505 Brookstone Ct
- 1151 Barkston Ln
- 2752 Preserve Cir Unit 13006
- 2748 Preserve Cir Unit 13005
- 2732 Preserve Cir Unit 13001
- 2892 Preserve Cir Unit 5003
- 2888 Preserve Cir Unit 5002
- 3158 Ollerton Ave Unit 361E
- 1104 Heathrow Ln
- 1311 Cranbrook Cir
- 1303 Cranbrook Cir
- 1312 Cranbrook Cir
- 1308 Cranbrook Cir
- 1316 Cranbrook Cir
- 1299 Cranbrook Cir
- 1319 Cranbrook Cir
- 1320 Cranbrook Cir
- 1323 Cranbrook Cir
- 1295 Cranbrook Cir
- 1280 Cranbrook Cir
- 1360 Cranbrook Cir
- 1276 Cranbrook Cir
- 1327 Cranbrook Cir
- 1368 Cranbrook Cir
- 1291 Cranbrook Cir
- 1364 Cranbrook Cir
- 1356 Cranbrook Cir
- 1272 Cranbrook Cir
- 1350 Cranbrook Cir
Your Personal Tour Guide
Ask me questions while you tour the home.