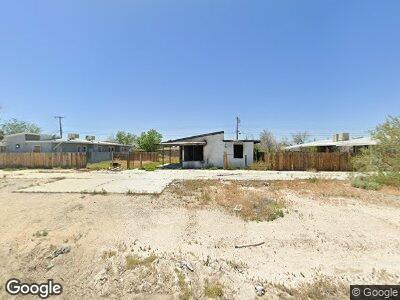
13071 Davenport St Unit A&B Edwards, CA 93523
Estimated Value: $195,000 - $284,000
6
Beds
2
Baths
2,076
Sq Ft
$112/Sq Ft
Est. Value
About This Home
This home is located at 13071 Davenport St Unit A&B, Edwards, CA 93523 and is currently estimated at $233,253, approximately $112 per square foot. 13071 Davenport St Unit A&B is a home located in Kern County with nearby schools including West Boron Elementary School and Boron Junior/Senior High School.
Ownership History
Date
Name
Owned For
Owner Type
Purchase Details
Closed on
Sep 20, 2021
Sold by
Hikin Boris and Estate Of Vlad Hikin
Bought by
Rrassk Services Inc
Current Estimated Value
Purchase Details
Closed on
Mar 10, 2010
Sold by
Pnc Bank National Association
Bought by
Hikin Vlad
Purchase Details
Closed on
Jun 20, 2009
Sold by
Martinez Adela
Bought by
National City Bank
Purchase Details
Closed on
Mar 8, 2006
Sold by
Mackellar John A and Mackellar Marsha A
Bought by
Martinez Adela
Home Financials for this Owner
Home Financials are based on the most recent Mortgage that was taken out on this home.
Original Mortgage
$130,500
Interest Rate
8.25%
Mortgage Type
Purchase Money Mortgage
Purchase Details
Closed on
Aug 12, 1996
Sold by
Mackellar John A and Mackellar Marsha A
Bought by
Great Western Bank Fsb
Create a Home Valuation Report for This Property
The Home Valuation Report is an in-depth analysis detailing your home's value as well as a comparison with similar homes in the area
Home Values in the Area
Average Home Value in this Area
Purchase History
| Date | Buyer | Sale Price | Title Company |
|---|---|---|---|
| Rrassk Services Inc | $240,000 | First Amer Ttl Co Glendale | |
| Hikin Vlad | $30,000 | Commerce Title Company | |
| National City Bank | $90,000 | None Available | |
| Martinez Adela | $145,000 | Commonwealth Land Title Co | |
| Great Western Bank Fsb | $46,130 | Chicago Title Co |
Source: Public Records
Mortgage History
| Date | Status | Borrower | Loan Amount |
|---|---|---|---|
| Open | Rrassk Services Inc | $100,000 | |
| Previous Owner | Martinez Adela | $130,500 |
Source: Public Records
Tax History Compared to Growth
Tax History
| Year | Tax Paid | Tax Assessment Tax Assessment Total Assessment is a certain percentage of the fair market value that is determined by local assessors to be the total taxable value of land and additions on the property. | Land | Improvement |
|---|---|---|---|---|
| 2024 | $1,363 | $83,232 | $10,404 | $72,828 |
| 2023 | $1,326 | $81,600 | $10,200 | $71,400 |
| 2022 | $749 | $36,480 | $9,726 | $26,754 |
| 2021 | $627 | $35,766 | $9,536 | $26,230 |
| 2020 | $573 | $35,401 | $9,439 | $25,962 |
| 2019 | $566 | $35,401 | $9,439 | $25,962 |
| 2018 | $559 | $34,027 | $9,073 | $24,954 |
| 2017 | $558 | $33,361 | $8,896 | $24,465 |
| 2016 | $520 | $32,708 | $8,722 | $23,986 |
| 2015 | $515 | $32,217 | $8,591 | $23,626 |
| 2014 | $507 | $31,587 | $8,423 | $23,164 |
Source: Public Records
Map
Nearby Homes
- 13115 Davenport St
- 13128 Lamel St
- 13171 Davenport St
- 13214 Lamel St
- 0 Fox St Unit 9992058
- 13001 Fox St & Lorraine Ave
- 13361 Davenport St
- 0 Ave Unit 25001914
- 13399 Davenport St
- 13398 Lamel St
- 13200 Lamel St
- 13443 Lamel St
- 13429 Lamel St
- 0 Alexander Ave & Clay Mine Rd Unit SR24213662
- 0 Alexander Ave & Clay Mine Rd Unit 24007727
- 0 Vl 230-200-40
- 0 Vl 230-200-42
- 16425 Frontage Rd
- 16400 Frontage Rd
- 16401 Glendower & Shotwell
- 13071 Davenport St Unit A&B
- 13071 Davenport St
- 13101 Davenport St
- 13100 Lamel St
- 13043 Davenport St Unit 4
- 13043 Davenport St
- 13129 Davenport St
- 13055 Lamel St
- 13143 Davenport St
- 13071 Lamel St
- 13101 Lamel St
- 13115 Lamel St
- 13043 Lamel St
- 13129 Lamel St
- 13157 Davenport St
- 13156 Lamel St
- 13143 Lamel St
- 13042 Clement St
- 13128 Clement St
- 13028 Clement St