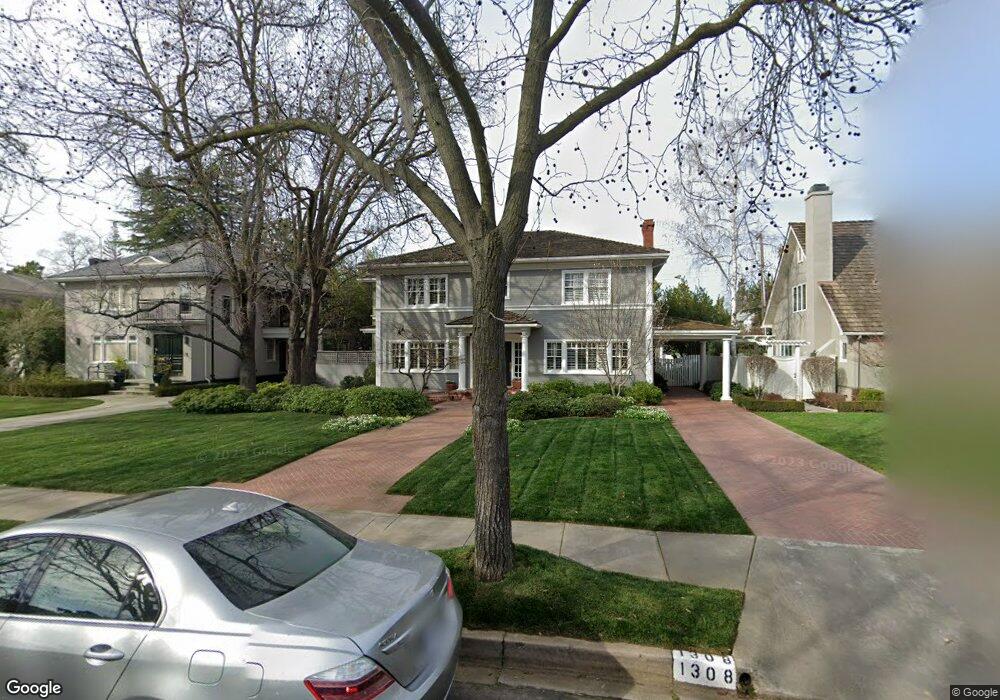
1308 38th St Sacramento, CA 95816
East Sacramento NeighborhoodEstimated Value: $1,327,000 - $2,132,000
4
Beds
4
Baths
3,447
Sq Ft
$512/Sq Ft
Est. Value
About This Home
This home is located at 1308 38th St, Sacramento, CA 95816 and is currently estimated at $1,764,279, approximately $511 per square foot. 1308 38th St is a home located in Sacramento County with nearby schools including David Lubin Elementary, Miwok Middle School, and Hiram W. Johnson High School.
Ownership History
Date
Name
Owned For
Owner Type
Purchase Details
Closed on
Feb 17, 2006
Sold by
Wasserman Eric T and Wasserman Marny J
Bought by
Wasserman Eric T and Wasserman Marny J
Current Estimated Value
Purchase Details
Closed on
Jul 21, 1998
Sold by
Wasserman Eric T and Wasserman Marny J
Bought by
Wasserman Eric T and Wasserman Marny J
Home Financials for this Owner
Home Financials are based on the most recent Mortgage that was taken out on this home.
Original Mortgage
$307,800
Interest Rate
7.01%
Purchase Details
Closed on
May 25, 1995
Sold by
Wasserman Eric T and Wasserman Marny J
Bought by
Wasserman Eric T and Wasserman Marny J
Create a Home Valuation Report for This Property
The Home Valuation Report is an in-depth analysis detailing your home's value as well as a comparison with similar homes in the area
Home Values in the Area
Average Home Value in this Area
Purchase History
| Date | Buyer | Sale Price | Title Company |
|---|---|---|---|
| Wasserman Eric T | -- | None Available | |
| Wasserman Eric T | -- | Financial Title Company | |
| Wasserman Eric T | -- | -- |
Source: Public Records
Mortgage History
| Date | Status | Borrower | Loan Amount |
|---|---|---|---|
| Previous Owner | Wasserman Eric T | $307,800 |
Source: Public Records
Tax History Compared to Growth
Tax History
| Year | Tax Paid | Tax Assessment Tax Assessment Total Assessment is a certain percentage of the fair market value that is determined by local assessors to be the total taxable value of land and additions on the property. | Land | Improvement |
|---|---|---|---|---|
| 2025 | $6,682 | $577,222 | $81,222 | $496,000 |
| 2024 | $6,682 | $565,905 | $79,630 | $486,275 |
| 2023 | $6,523 | $554,810 | $78,069 | $476,741 |
| 2022 | $6,413 | $543,933 | $76,539 | $467,394 |
| 2021 | $6,106 | $533,269 | $75,039 | $458,230 |
| 2020 | $6,158 | $527,802 | $74,270 | $453,532 |
| 2019 | $6,026 | $517,454 | $72,814 | $444,640 |
| 2018 | $5,867 | $507,309 | $71,387 | $435,922 |
| 2017 | $5,785 | $497,363 | $69,988 | $427,375 |
| 2016 | $5,627 | $487,612 | $68,616 | $418,996 |
| 2015 | $5,544 | $480,289 | $67,586 | $412,703 |
| 2014 | $5,390 | $470,882 | $66,263 | $404,619 |
Source: Public Records
Map
Nearby Homes