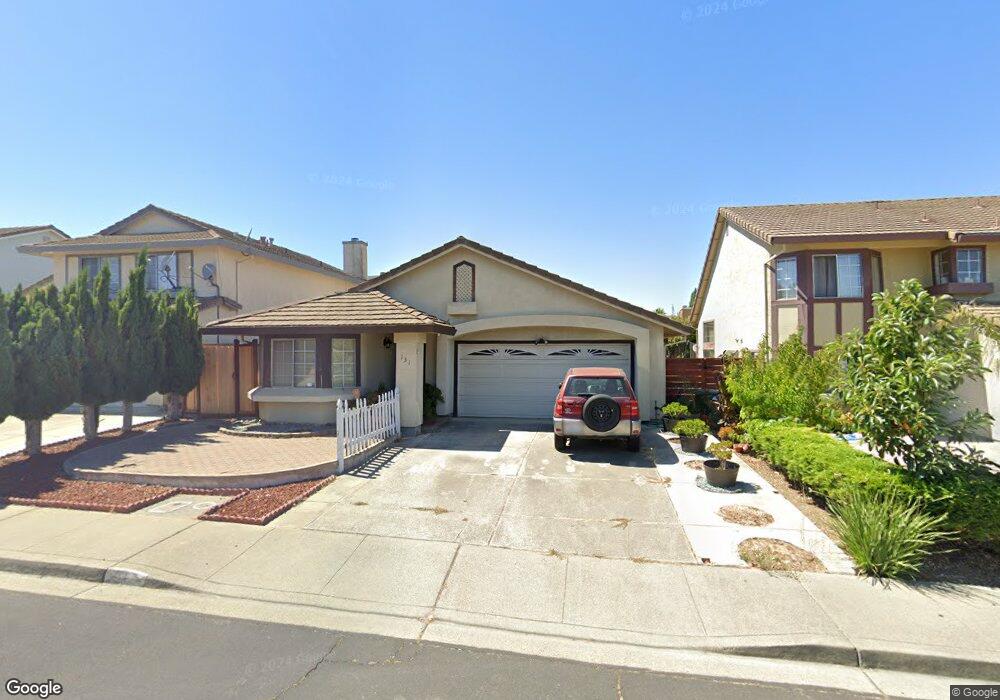
131 Copper Way Vallejo, CA 94589
North Vallejo NeighborhoodEstimated Value: $520,000 - $557,000
4
Beds
2
Baths
1,375
Sq Ft
$391/Sq Ft
Est. Value
About This Home
This home is located at 131 Copper Way, Vallejo, CA 94589 and is currently estimated at $538,168, approximately $391 per square foot. 131 Copper Way is a home located in Solano County with nearby schools including Elsa Widenmann Elementary, Solano Middle School, and Vallejo High School.
Ownership History
Date
Name
Owned For
Owner Type
Purchase Details
Closed on
Mar 21, 2005
Sold by
Ramos Virgilio M and Ramos Dorothy M
Bought by
Ramos Tomas C
Current Estimated Value
Home Financials for this Owner
Home Financials are based on the most recent Mortgage that was taken out on this home.
Original Mortgage
$352,000
Outstanding Balance
$260,249
Interest Rate
5.5%
Mortgage Type
Purchase Money Mortgage
Estimated Equity
$277,919
Purchase Details
Closed on
Jan 22, 2002
Sold by
Ramos Virgilio M and Ramos Dorothy M
Bought by
Ramos Virgilio M and Ramos Dorothy M
Purchase Details
Closed on
Nov 30, 2001
Sold by
Ramos Lawrence M
Bought by
Ramos Virgilio M and Ramos Dorothy M
Purchase Details
Closed on
Sep 27, 1999
Sold by
Ramos Virgilio M and Ramos D M
Bought by
Ramos Lawrence M
Home Financials for this Owner
Home Financials are based on the most recent Mortgage that was taken out on this home.
Original Mortgage
$132,000
Interest Rate
7.97%
Mortgage Type
Stand Alone First
Create a Home Valuation Report for This Property
The Home Valuation Report is an in-depth analysis detailing your home's value as well as a comparison with similar homes in the area
Home Values in the Area
Average Home Value in this Area
Purchase History
We collect this data history from publicly available records. To have your information removed, we recommend requesting removal directly through your county’s website.
| Date | Buyer | Sale Price | Title Company |
|---|---|---|---|
| Ramos Tomas C | $105,000 | First American Title Co | |
| Ramos Virgilio M | $78,000 | -- | |
| Ramos Virgilio M | -- | -- | |
| Ramos Lawrence M | $165,000 | First American Title Guarant |
Source: Public Records
Mortgage History
We collect this data history from publicly available records. To have your information removed, we recommend requesting removal directly through your county’s website.
| Date | Status | Borrower | Loan Amount |
|---|---|---|---|
| Open | Ramos Tomas C | $352,000 | |
| Closed | Ramos Lawrence M | $132,000 | |
| Closed | Ramos Lawrence M | $24,750 |
Source: Public Records
Tax History
| Year | Tax Paid | Tax Assessment Tax Assessment Total Assessment is a certain percentage of the fair market value that is determined by local assessors to be the total taxable value of land and additions on the property. | Land | Improvement |
|---|---|---|---|---|
| 2025 | $7,244 | $533,600 | $42,000 | $491,600 |
| 2024 | $7,244 | $533,600 | $42,000 | $491,600 |
| 2023 | $7,002 | $533,600 | $42,000 | $491,600 |
| 2022 | $7,051 | $533,600 | $42,000 | $491,600 |
| 2021 | $6,178 | $460,000 | $41,000 | $419,000 |
| 2020 | $5,556 | $398,000 | $39,000 | $359,000 |
| 2019 | $5,485 | $397,000 | $43,000 | $354,000 |
| 2018 | $5,057 | $381,000 | $45,000 | $336,000 |
| 2017 | $4,276 | $322,000 | $41,000 | $281,000 |
| 2016 | $3,291 | $279,000 | $39,000 | $240,000 |
| 2015 | $3,263 | $276,000 | $41,000 | $235,000 |
| 2014 | $3,045 | $210,000 | $32,000 | $178,000 |
Source: Public Records
Map
Nearby Homes
- 475 Whitney Ave
- 490 Whitney Ave
- 223 Gypsum Dr
- 0 Antioch Dr
- 431 Gonzaga Ave
- 1011 Loyola Way
- 137 Hastings Ave
- 156 Sawyer St
- 116 Encerti Ave
- 355 Parkview Terrace Unit 7
- 355 Parkview Terrace Unit B9
- 355 Parkview Terrace Unit A-8
- 128 Evelyn Cir
- 464 Evelyn Cir
- 355 Lofas Place
- 221 Parkview Terrace
- 116 Cynthia Ave
- 243 Sage St
- 301 Baylor Dr
- 144 Hogan Ave
Your Personal Tour Guide
Ask me questions while you tour the home.