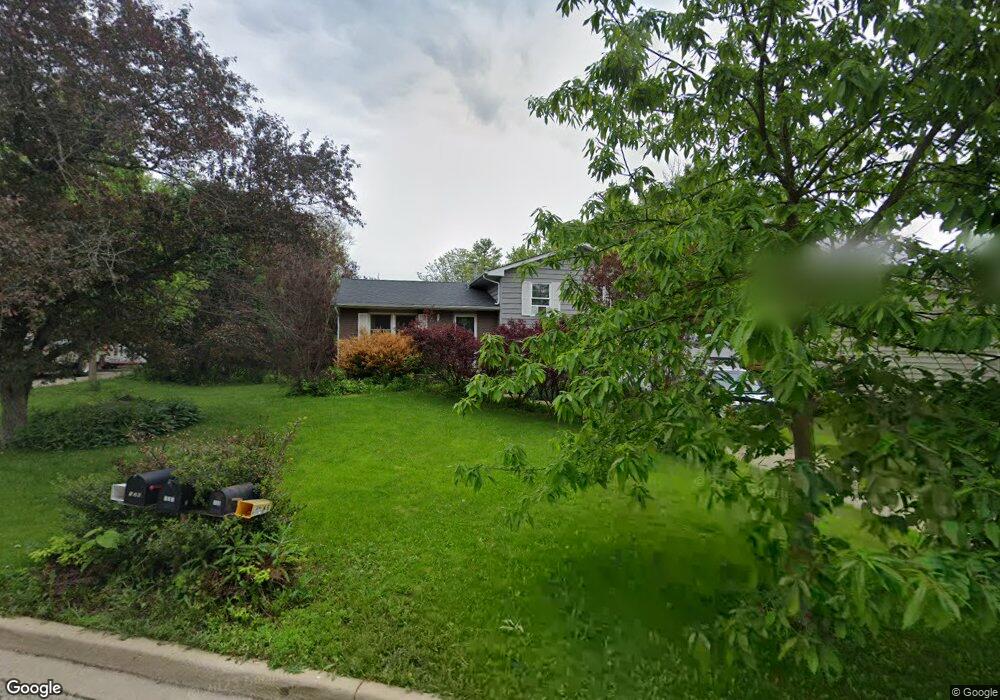
131 Mohawk Trail Algonquin, IL 60102
Merrill Algonquin Hills NeighborhoodEstimated Value: $334,000 - $397,000
Studio
1
Bath
1,184
Sq Ft
$309/Sq Ft
Est. Value
About This Home
This home is located at 131 Mohawk Trail, Algonquin, IL 60102 and is currently estimated at $366,265, approximately $309 per square foot. 131 Mohawk Trail is a home located in McHenry County with nearby schools including Eastview Elementary School, Algonquin Middle School, and Dundee-Crown High School.
Ownership History
Date
Name
Owned For
Owner Type
Purchase Details
Closed on
May 12, 2015
Sold by
Perez Christopher A
Bought by
Perez Christopher A and Christopher A Perez Trust
Current Estimated Value
Purchase Details
Closed on
Mar 11, 2015
Sold by
Perez Christopher A
Bought by
Perez Christopher A
Home Financials for this Owner
Home Financials are based on the most recent Mortgage that was taken out on this home.
Original Mortgage
$149,700
Interest Rate
3%
Mortgage Type
New Conventional
Purchase Details
Closed on
Sep 19, 2014
Sold by
Perez Christopher A
Bought by
Perez Christopher A and Christopher A Perez Trust
Purchase Details
Closed on
Dec 7, 2005
Sold by
Prather Delbert R and Prather Lynn J
Bought by
Perez Christopher A
Home Financials for this Owner
Home Financials are based on the most recent Mortgage that was taken out on this home.
Original Mortgage
$196,000
Interest Rate
6.36%
Mortgage Type
Fannie Mae Freddie Mac
Create a Home Valuation Report for This Property
The Home Valuation Report is an in-depth analysis detailing your home's value as well as a comparison with similar homes in the area
Home Values in the Area
Average Home Value in this Area
Purchase History
| Date | Buyer | Sale Price | Title Company |
|---|---|---|---|
| Perez Christopher A | -- | None Available | |
| Perez Christopher A | -- | Heritage Title Company | |
| Perez Christopher A | -- | None Available | |
| Perez Christopher A | $245,000 | Heritage Title Company |
Source: Public Records
Mortgage History
| Date | Status | Borrower | Loan Amount |
|---|---|---|---|
| Closed | Perez Christopher A | $149,700 | |
| Closed | Perez Christopher A | $196,000 |
Source: Public Records
Tax History
| Year | Tax Paid | Tax Assessment Tax Assessment Total Assessment is a certain percentage of the fair market value that is determined by local assessors to be the total taxable value of land and additions on the property. | Land | Improvement |
|---|---|---|---|---|
| 2024 | $8,106 | $103,627 | $24,788 | $78,839 |
| 2023 | $7,759 | $92,682 | $22,170 | $70,512 |
| 2022 | $7,739 | $90,237 | $23,597 | $66,640 |
| 2021 | $7,459 | $84,066 | $21,983 | $62,083 |
| 2020 | $7,281 | $81,090 | $21,205 | $59,885 |
| 2019 | $7,127 | $77,613 | $20,296 | $57,317 |
| 2018 | $6,834 | $71,698 | $18,749 | $52,949 |
| 2017 | $6,726 | $67,544 | $17,663 | $49,881 |
| 2016 | $6,662 | $63,350 | $16,566 | $46,784 |
| 2013 | -- | $53,022 | $15,453 | $37,569 |
Source: Public Records
Map
Nearby Homes
- 1439 Lowe Dr
- 1302 Cary Rd
- 1625 Powder Horn Dr
- lot 021 Route 31 Hwy
- 953 Old Oak Cir
- 1730 Tanglewood Dr
- 720 Ash St
- 1188 E Algonquin Rd
- 1031 Timberwood Ln
- 600 E Algonquin Rd
- 0 River Dr N Unit MRD12473279
- 719 Webster St
- 9416 3rd Ave
- 1770 E Algonquin Rd
- Lot 4 b Ryan Pkwy
- 1321 Big Sur Pkwy
- 407 La Fox River Dr
- 1782 Cumberland Pkwy
- 2 Cumberland Pkwy
- 1121 Redwood Dr
- 125 Mohawk Trail
- 1400 Seminole Rd
- 114 Iona Terrace
- 1420 N Harrison St
- 1414 N Harrison St
- 1426 N Harrison St
- 1500 Seminole Rd
- 1400 N Harrison St
- 136 Mohawk Trail
- 1410 Seminole Rd
- 1432 N Harrison St
- 130 Mohawk Trail
- 1438 N Harrison St
- 1420 Seminole Rd
- 124 Mohawk Trail
- 1444 N Harrison St
- 1432 Seminole Rd
- 118 Mohawk Trail
- 1438 Seminole Rd
- 100 Mohawk Trail
Your Personal Tour Guide
Ask me questions while you tour the home.