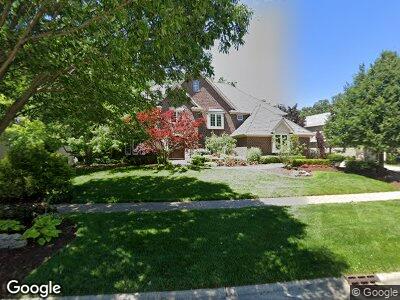
131 Settlers Dr Naperville, IL 60565
Knoch Knolls NeighborhoodEstimated Value: $1,024,955 - $1,399,000
5
Beds
4
Baths
4,710
Sq Ft
$249/Sq Ft
Est. Value
About This Home
This home is located at 131 Settlers Dr, Naperville, IL 60565 and is currently estimated at $1,173,985, approximately $249 per square foot. 131 Settlers Dr is a home located in Will County with nearby schools including Kingsley Elementary School, Lincoln Jr. High School, and Naperville Central High School.
Ownership History
Date
Name
Owned For
Owner Type
Purchase Details
Closed on
Oct 14, 1997
Sold by
Tremont Homes Ltd
Bought by
Tessiatore Jeffry S and Tessiatore Kimberly S
Current Estimated Value
Home Financials for this Owner
Home Financials are based on the most recent Mortgage that was taken out on this home.
Original Mortgage
$400,000
Outstanding Balance
$75,511
Interest Rate
7.38%
Estimated Equity
$1,133,269
Purchase Details
Closed on
Jan 17, 1996
Sold by
Midamerica Development Services Inc
Bought by
Tremont Homes Ltd
Home Financials for this Owner
Home Financials are based on the most recent Mortgage that was taken out on this home.
Original Mortgage
$155,650
Interest Rate
7.74%
Mortgage Type
Construction
Create a Home Valuation Report for This Property
The Home Valuation Report is an in-depth analysis detailing your home's value as well as a comparison with similar homes in the area
Home Values in the Area
Average Home Value in this Area
Purchase History
| Date | Buyer | Sale Price | Title Company |
|---|---|---|---|
| Tessiatore Jeffry S | $660,000 | -- | |
| Tremont Homes Ltd | $195,000 | Chicago Title Insurance Co |
Source: Public Records
Mortgage History
| Date | Status | Borrower | Loan Amount |
|---|---|---|---|
| Closed | Tessiatore Jeffry S | $229,500 | |
| Closed | Tessiatore Jeffrey S | $231,500 | |
| Closed | Tessiatore Jeffry S | $233,000 | |
| Closed | Tessiatore Jeffrey S | $240,000 | |
| Closed | Tessiatore Jeffry S | $240,000 | |
| Open | Tessiatore Jeffry S | $400,000 | |
| Previous Owner | Tremont Homes Ltd | $155,650 |
Source: Public Records
Tax History Compared to Growth
Tax History
| Year | Tax Paid | Tax Assessment Tax Assessment Total Assessment is a certain percentage of the fair market value that is determined by local assessors to be the total taxable value of land and additions on the property. | Land | Improvement |
|---|---|---|---|---|
| 2023 | $23,212 | $330,907 | $69,637 | $261,270 |
| 2022 | $20,783 | $308,144 | $62,781 | $245,363 |
| 2021 | $19,418 | $288,119 | $58,701 | $229,418 |
| 2020 | $18,696 | $278,645 | $56,771 | $221,874 |
| 2019 | $18,071 | $265,377 | $54,068 | $211,309 |
| 2018 | $17,260 | $253,998 | $51,750 | $202,248 |
| 2017 | $17,918 | $258,877 | $52,744 | $206,133 |
| 2016 | $18,061 | $256,700 | $52,300 | $204,400 |
| 2015 | $18,480 | $246,300 | $50,200 | $196,100 |
| 2014 | $18,480 | $246,300 | $50,200 | $196,100 |
| 2013 | $18,480 | $246,300 | $50,200 | $196,100 |
Source: Public Records
Map
Nearby Homes
- 51 Ford Ln
- 354 Gateshead Dr
- 15 Pinnacle Ct
- 44 Oak Bluff Ct
- 16 Rock River Ct
- 2624 Haddassah Dr
- 2755 Newport Dr
- 348 Westbrook Cir
- 2756 Fox River Ln
- 404 Verbena Ct
- 219 Fiala Woods Ct
- 2717 Newport Dr
- 2438 River Woods Dr
- 480 De Lasalle Ave
- 2327 Worthing Dr Unit 202D
- 487 Blodgett Ct
- 2564 Brockton Cir
- 200 Hampshire Ct Unit 101A
- 2802 Wedgewood Dr
- 2384 Bennington Ct
- 131 Settlers Dr
- 127 Settlers Dr
- 135 Settlers Dr
- 112 Trappers Ct
- 116 Trappers Ct
- 123 Settlers Dr
- 108 Trappers Ct
- 136 Settlers Dr
- 132 Settlers Dr
- 140 Settlers Dr
- 128 Settlers Dr
- 119 Settlers Dr
- 203 Settlers Ct
- 204 Settlers Ct
- 104 Trappers Ct
- 124 Settlers Dr
- 204 Crooked Tree Ct
- 111 Trappers Ct
- 115 Trappers Ct
- 115 Settlers Dr