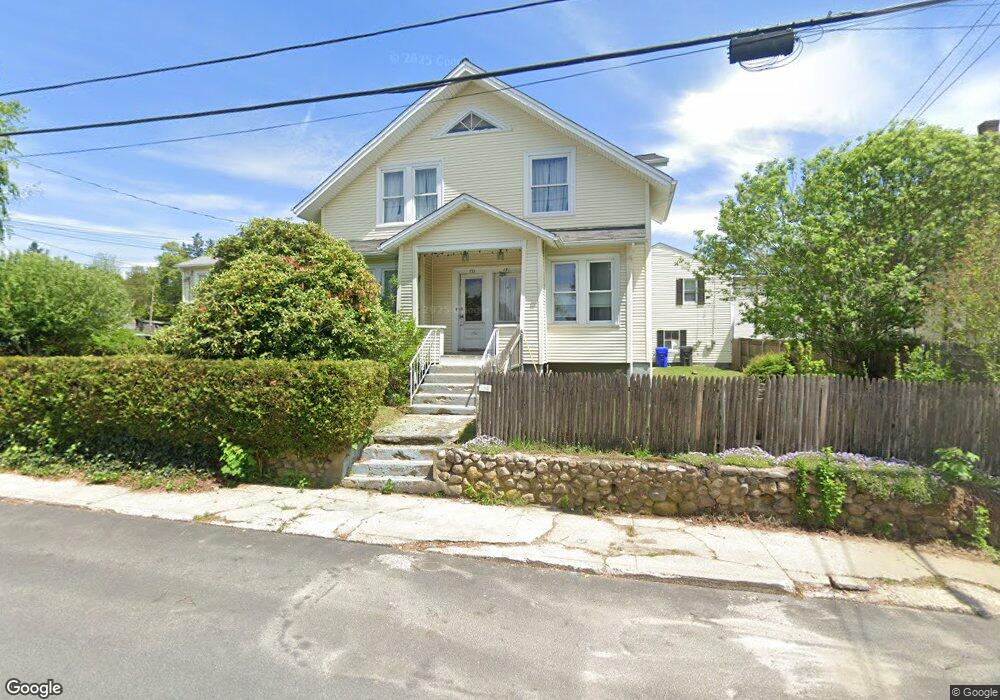
131 West St West Warwick, RI 02893
West Warwick Centre NeighborhoodEstimated Value: $392,000 - $589,000
6
Beds
2
Baths
2,812
Sq Ft
$170/Sq Ft
Est. Value
About This Home
This home is located at 131 West St, West Warwick, RI 02893 and is currently estimated at $479,402, approximately $170 per square foot. 131 West St is a home located in Kent County with nearby schools including West Warwick High School and Islamic School of Rhode Island.
Ownership History
Date
Name
Owned For
Owner Type
Purchase Details
Closed on
May 19, 2025
Sold by
Raheb Ronald
Bought by
Koenig Yanick and Koenig Joelle
Current Estimated Value
Home Financials for this Owner
Home Financials are based on the most recent Mortgage that was taken out on this home.
Original Mortgage
$375,000
Outstanding Balance
$373,718
Interest Rate
6.83%
Mortgage Type
Purchase Money Mortgage
Estimated Equity
$105,684
Purchase Details
Closed on
Mar 19, 2025
Sold by
Snow Randall
Bought by
Raheb Ronald
Purchase Details
Closed on
Sep 10, 2020
Sold by
West Warwick Town Of
Bought by
Reservoir Adventures Llc
Purchase Details
Closed on
Jun 27, 2011
Sold by
Norman Reisch T
Bought by
Snow Randall
Home Financials for this Owner
Home Financials are based on the most recent Mortgage that was taken out on this home.
Original Mortgage
$140,000
Interest Rate
4.63%
Mortgage Type
Purchase Money Mortgage
Purchase Details
Closed on
May 3, 2011
Sold by
Leveille Pierre L
Bought by
Reisch Norman
Home Financials for this Owner
Home Financials are based on the most recent Mortgage that was taken out on this home.
Original Mortgage
$140,000
Interest Rate
4.63%
Mortgage Type
Purchase Money Mortgage
Create a Home Valuation Report for This Property
The Home Valuation Report is an in-depth analysis detailing your home's value as well as a comparison with similar homes in the area
Home Values in the Area
Average Home Value in this Area
Purchase History
| Date | Buyer | Sale Price | Title Company |
|---|---|---|---|
| Koenig Yanick | $395,000 | None Available | |
| Koenig Yanick | $395,000 | None Available | |
| Raheb Ronald | $300,000 | None Available | |
| Raheb Ronald | $300,000 | None Available | |
| Reservoir Adventures Llc | $19,133 | None Available | |
| Reservoir Adventures Llc | $19,133 | None Available | |
| Snow Randall | $150,000 | -- | |
| Snow Randall | $150,000 | -- | |
| Reisch Norman | -- | -- | |
| Reisch Norman | -- | -- |
Source: Public Records
Mortgage History
| Date | Status | Borrower | Loan Amount |
|---|---|---|---|
| Open | Koenig Yanick | $375,000 | |
| Closed | Koenig Yanick | $375,000 | |
| Previous Owner | Reisch Norman | $140,000 |
Source: Public Records
Tax History
| Year | Tax Paid | Tax Assessment Tax Assessment Total Assessment is a certain percentage of the fair market value that is determined by local assessors to be the total taxable value of land and additions on the property. | Land | Improvement |
|---|---|---|---|---|
| 2025 | $7,929 | $518,600 | $84,000 | $434,600 |
| 2024 | $7,246 | $354,000 | $53,400 | $300,600 |
| 2023 | $7,105 | $354,000 | $53,400 | $300,600 |
| 2022 | $6,386 | $354,000 | $53,400 | $300,600 |
| 2021 | $5,334 | $231,900 | $43,800 | $188,100 |
| 2020 | $6,931 | $231,900 | $43,800 | $188,100 |
| 2019 | $6,799 | $231,900 | $43,800 | $188,100 |
| 2018 | $7,420 | $194,800 | $41,200 | $153,600 |
| 2017 | $7,393 | $194,800 | $41,200 | $153,600 |
| 2016 | $7,260 | $194,800 | $41,200 | $153,600 |
| 2015 | $6,917 | $185,600 | $41,200 | $144,400 |
| 2014 | $6,765 | $185,600 | $41,200 | $144,400 |
Source: Public Records
Map
Nearby Homes
Your Personal Tour Guide
Ask me questions while you tour the home.