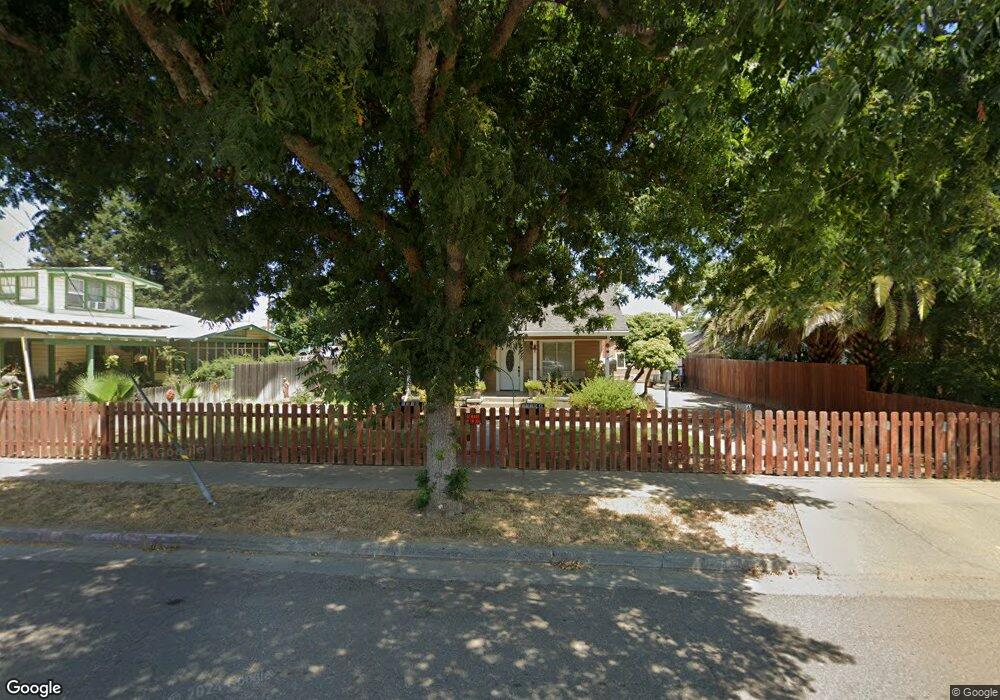
1310 South St Corning, CA 96021
Estimated Value: $215,000 - $315,000
3
Beds
2
Baths
1,276
Sq Ft
$214/Sq Ft
Est. Value
About This Home
This home is located at 1310 South St, Corning, CA 96021 and is currently estimated at $273,687, approximately $214 per square foot. 1310 South St is a home located in Tehama County with nearby schools including West Street Elementary School, Maywood Middle School, and Corning High School.
Ownership History
Date
Name
Owned For
Owner Type
Purchase Details
Closed on
Dec 4, 2019
Sold by
Edwards Janie L
Bought by
Oseguera Alberto and Sanchez Maria
Current Estimated Value
Home Financials for this Owner
Home Financials are based on the most recent Mortgage that was taken out on this home.
Original Mortgage
$125,000
Outstanding Balance
$110,421
Interest Rate
3.7%
Mortgage Type
Unknown
Estimated Equity
$163,266
Purchase Details
Closed on
Feb 21, 2018
Sold by
Edwards Janie
Bought by
Edwards Janie L
Purchase Details
Closed on
Aug 18, 2010
Sold by
Federal Home Loan Mortgage Corporation
Bought by
Edwards Janie
Purchase Details
Closed on
Jul 7, 2010
Sold by
Perry Deborah Ann
Bought by
Federal Home Loan Mortgage Corporation
Create a Home Valuation Report for This Property
The Home Valuation Report is an in-depth analysis detailing your home's value as well as a comparison with similar homes in the area
Purchase History
| Date | Buyer | Sale Price | Title Company |
|---|---|---|---|
| Oseguera Alberto | $165,000 | Old Republic Title Epn | |
| Edwards Janie L | -- | None Available | |
| Edwards Janie | $70,000 | Fidelity National Title Co | |
| Federal Home Loan Mortgage Corporation | $97,861 | Accommodation |
Source: Public Records
Mortgage History
| Date | Status | Borrower | Loan Amount |
|---|---|---|---|
| Open | Oseguera Alberto | $125,000 |
Source: Public Records
Tax History
| Year | Tax Paid | Tax Assessment Tax Assessment Total Assessment is a certain percentage of the fair market value that is determined by local assessors to be the total taxable value of land and additions on the property. | Land | Improvement |
|---|---|---|---|---|
| 2025 | $2,221 | $215,299 | $43,743 | $171,556 |
| 2023 | $2,179 | $206,942 | $42,046 | $164,896 |
| 2022 | $1,802 | $170,042 | $41,222 | $128,820 |
| 2021 | $1,734 | $166,709 | $40,414 | $126,295 |
| 2020 | $1,753 | $165,000 | $40,000 | $125,000 |
| 2019 | $833 | $79,814 | $34,452 | $45,362 |
| 2018 | $834 | $78,250 | $33,777 | $44,473 |
| 2017 | $829 | $76,716 | $33,115 | $43,601 |
| 2016 | $773 | $75,213 | $32,466 | $42,747 |
| 2015 | -- | $74,084 | $31,979 | $42,105 |
| 2014 | $755 | $72,634 | $31,353 | $41,281 |
Source: Public Records
Map
Nearby Homes
- 1216 South St
- 1214 Marin St
- 1162 5th Ave
- 1195 West St
- 1419 Yolo St
- 1311 6th Ave
- 1410 4th Ave
- 611 Hoag St
- 815 Marin St
- 1568 Link St
- 311 6th St
- 1409 North St
- 2018 Donnovan Ave
- 0 Toomes Ave Unit SN25272183
- 0 Toomes Ave Unit SN24222817
- 0 Toomes Ave Unit SN25176211
- 1308 Pear St
- 1980 Colusa St
- 488 Chestnut St
- 1547 Blackburn Ave
Your Personal Tour Guide
Ask me questions while you tour the home.