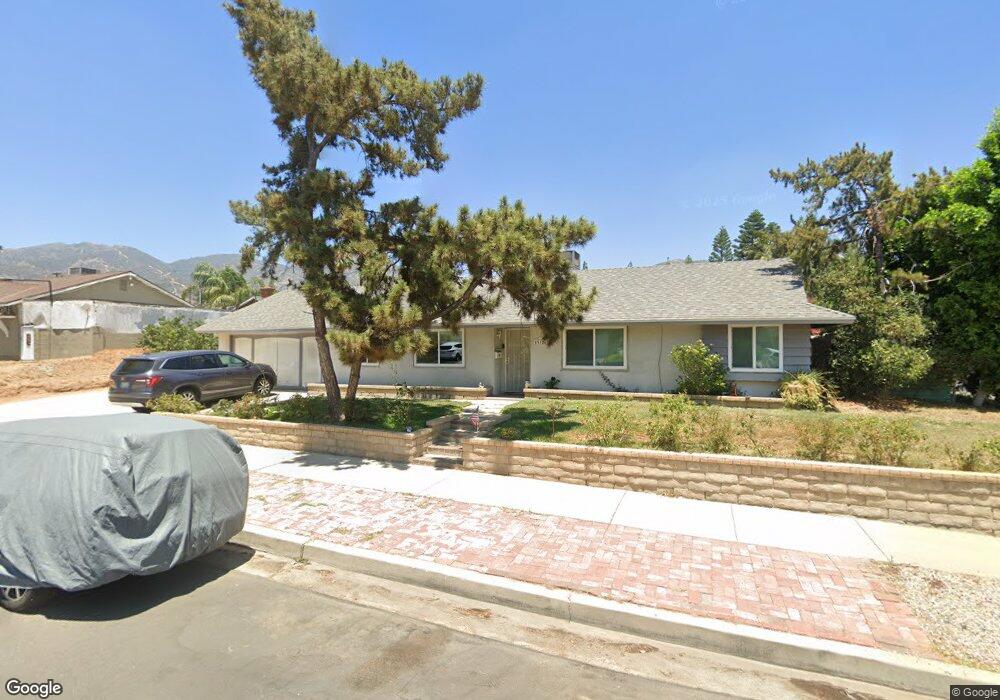
13126 Cranston Ave Sylmar, CA 91342
Estimated Value: $775,334 - $851,000
4
Beds
2
Baths
1,316
Sq Ft
$620/Sq Ft
Est. Value
About This Home
This home is located at 13126 Cranston Ave, Sylmar, CA 91342 and is currently estimated at $815,334, approximately $619 per square foot. 13126 Cranston Ave is a home located in Los Angeles County with nearby schools including Harding Street Elementary School, San Fernando Middle School, and San Fernando Senior High School.
Ownership History
Date
Name
Owned For
Owner Type
Purchase Details
Closed on
May 20, 2011
Sold by
Gonzalez Maria Elena Wedel and Wedel Maria Elena
Bought by
Gonzalez Maria Elena Wedel and Johnson Helen
Current Estimated Value
Purchase Details
Closed on
Jun 23, 2005
Sold by
Wedel Maria Elena and Wedel Maria E
Bought by
Wedel Maria Elena
Home Financials for this Owner
Home Financials are based on the most recent Mortgage that was taken out on this home.
Original Mortgage
$185,000
Outstanding Balance
$95,022
Interest Rate
5.51%
Mortgage Type
New Conventional
Estimated Equity
$720,312
Purchase Details
Closed on
Oct 14, 2003
Sold by
Gonzalez Jose Dejesus
Bought by
Wedel Maria Elena
Home Financials for this Owner
Home Financials are based on the most recent Mortgage that was taken out on this home.
Original Mortgage
$145,000
Interest Rate
5.89%
Mortgage Type
Stand Alone First
Purchase Details
Closed on
Mar 22, 1995
Sold by
Valdez Gabina H
Bought by
Wedel Maria E
Create a Home Valuation Report for This Property
The Home Valuation Report is an in-depth analysis detailing your home's value as well as a comparison with similar homes in the area
Home Values in the Area
Average Home Value in this Area
Purchase History
| Date | Buyer | Sale Price | Title Company |
|---|---|---|---|
| Gonzalez Maria Elena Wedel | -- | None Available | |
| Wedel Maria Elena | -- | Ticor Title Company | |
| Wedel Maria Elena | -- | Ticor Title Co | |
| Wedel Maria E | -- | -- |
Source: Public Records
Mortgage History
| Date | Status | Borrower | Loan Amount |
|---|---|---|---|
| Open | Wedel Maria Elena | $185,000 | |
| Closed | Wedel Maria Elena | $145,000 |
Source: Public Records
Tax History Compared to Growth
Tax History
| Year | Tax Paid | Tax Assessment Tax Assessment Total Assessment is a certain percentage of the fair market value that is determined by local assessors to be the total taxable value of land and additions on the property. | Land | Improvement |
|---|---|---|---|---|
| 2025 | $3,342 | $253,150 | $111,989 | $141,161 |
| 2024 | $3,342 | $248,188 | $109,794 | $138,394 |
| 2023 | $3,283 | $243,323 | $107,642 | $135,681 |
| 2022 | $3,139 | $238,553 | $105,532 | $133,021 |
| 2021 | $3,097 | $233,876 | $103,463 | $130,413 |
| 2019 | $3,011 | $226,942 | $100,396 | $126,546 |
| 2018 | $2,911 | $222,493 | $98,428 | $124,065 |
| 2016 | $2,775 | $213,856 | $94,607 | $119,249 |
| 2015 | $2,737 | $210,644 | $93,186 | $117,458 |
| 2014 | $2,755 | $206,519 | $91,361 | $115,158 |
Source: Public Records
Map
Nearby Homes
- 12940 Harding St
- 13247 Tripoli Ave
- 13197 Leach St
- 13372 Hyland Ct
- 13166 Aztec St
- 13475 Hubbard St Unit 31
- 13103 Angeles Trail Way Unit 301
- 13095 Hubbard St Unit 1
- 12745 N Watt Ln Unit B
- 12745 N Watt Ln Unit B
- 13540 Hubbard St Unit 21
- 13219 Shaw Ln
- 13912 N Mesa Alta Rd
- 13414 Herron St
- 12888 Four Palms Ln
- 13384 Foothill Blvd
- 13547 Mindora Ave
- 13307 Herron St
- 13204 Alta Vista Way
- 13550 Foothill Blvd Unit 27
- 12961 Fernmont St
- 13136 Cranston Ave
- 12976 Tarquin St
- 12953 Fernmont St
- 13110 Cranston Ave
- 13129 Cranston Ave
- 13135 Cranston Ave
- 12960 Fernmont St
- 13123 Cranston Ave
- 12970 Tarquin St
- 13143 Cranston Ave
- 13117 Cranston Ave
- 12952 Fernmont St
- 12945 Fernmont St
- 12962 Tarquin St
- 13149 Cranston Ave
- 13111 Cranston Ave
- 13100 Cranston Ave
- 13152 Cranston Ave
- 12944 Fernmont St