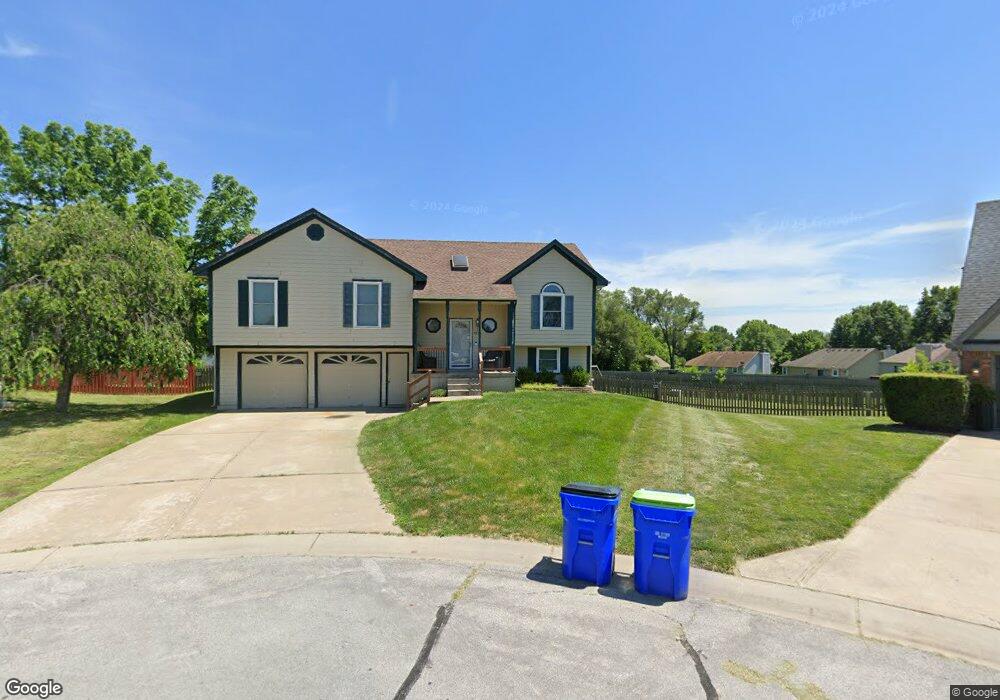
1313 NE Burgandy Ct Lees Summit, MO 64086
Estimated Value: $306,058 - $337,000
4
Beds
3
Baths
1,312
Sq Ft
$251/Sq Ft
Est. Value
About This Home
This home is located at 1313 NE Burgandy Ct, Lees Summit, MO 64086 and is currently estimated at $328,765, approximately $250 per square foot. 1313 NE Burgandy Ct is a home located in Jackson County with nearby schools including Underwood Elementary School, Bernard C. Campbell Middle School, and Lee's Summit North High School.
Ownership History
Date
Name
Owned For
Owner Type
Purchase Details
Closed on
Dec 8, 2022
Sold by
Kmlr Investments Llc
Bought by
Bartels Adam
Current Estimated Value
Home Financials for this Owner
Home Financials are based on the most recent Mortgage that was taken out on this home.
Original Mortgage
$240,000
Outstanding Balance
$232,968
Interest Rate
7.08%
Mortgage Type
Credit Line Revolving
Estimated Equity
$95,797
Purchase Details
Closed on
Jul 17, 1997
Sold by
Caponetto Thomas J and Caponetto Thomas J
Bought by
Kelley William W and Kelley Sheryl L
Home Financials for this Owner
Home Financials are based on the most recent Mortgage that was taken out on this home.
Original Mortgage
$87,800
Interest Rate
7.85%
Mortgage Type
Purchase Money Mortgage
Purchase Details
Closed on
Nov 17, 1995
Sold by
Caponetto Cheri L
Bought by
Caponetto Thomas J
Create a Home Valuation Report for This Property
The Home Valuation Report is an in-depth analysis detailing your home's value as well as a comparison with similar homes in the area
Home Values in the Area
Average Home Value in this Area
Purchase History
| Date | Buyer | Sale Price | Title Company |
|---|---|---|---|
| Bartels Adam | -- | -- | |
| Kmlr Investments Llc | -- | -- | |
| Kelley William W | -- | Realty Title Company | |
| Caponetto Thomas J | -- | -- |
Source: Public Records
Mortgage History
| Date | Status | Borrower | Loan Amount |
|---|---|---|---|
| Open | Kmlr Investments Llc | $240,000 | |
| Closed | Bartels Adam | $115,000 | |
| Previous Owner | Kelley William W | $87,800 |
Source: Public Records
Tax History Compared to Growth
Tax History
| Year | Tax Paid | Tax Assessment Tax Assessment Total Assessment is a certain percentage of the fair market value that is determined by local assessors to be the total taxable value of land and additions on the property. | Land | Improvement |
|---|---|---|---|---|
| 2025 | $3,293 | $46,736 | $7,908 | $38,828 |
| 2024 | $3,269 | $45,600 | $12,285 | $33,315 |
| 2023 | $3,269 | $45,600 | $4,827 | $40,773 |
| 2022 | $2,853 | $35,340 | $4,827 | $30,513 |
| 2021 | $2,912 | $35,340 | $4,827 | $30,513 |
| 2020 | $2,746 | $33,006 | $4,827 | $28,179 |
| 2019 | $2,671 | $33,006 | $4,827 | $28,179 |
| 2018 | $984,552 | $28,726 | $4,201 | $24,525 |
| 2017 | $2,468 | $28,726 | $4,201 | $24,525 |
| 2016 | $2,468 | $28,006 | $4,028 | $23,978 |
| 2014 | $2,438 | $27,126 | $3,772 | $23,354 |
Source: Public Records
Map
Nearby Homes
- 1817 NE Burgandy Cir
- 1400 NE Colbern Rd
- 1632 NE Stonewood Dr
- 1637 NE Westwind Dr
- 1717 NE Luther Rd
- 1424 NE Stonewood Dr
- 1425 NE Stonewood Dr
- 1408 NE Whitestone Dr
- 27008 E Olive Dr
- 27104 E Cedar Grove Dr
- 1220 NE Hendrix Dr
- 1708 NE Balboa St
- 808 NE Mulberry St
- 809 NE Mulberry St
- 800 NE Mulberry St
- 1121 NE Ridgeview Dr
- 718 NE Mulberry St
- 717 NE Mulberry St
- 732 NE Deerbrook St
- 1676 NE Ozark Dr
- 1317 NE Burgandy Ct
- 1309 NE Burgandy Ct
- 1321 NE Burgandy Ln
- 1305 NE Burgandy Ct
- 1820 NE Burgandy Cir
- 1301 NE Burgandy Ct
- 1816 NE Burgandy Cir
- 1812 NE Burgandy Cir
- 1308 NE Burgandy Ln
- 1312 NE Burgandy Ln
- 1325 NE Burgandy Ln
- 1824 NE Burgandy Cir
- 1316 NE Burgandy Ln
- 1304 NE Burgandy Ln
- 1320 NE Burgandy Ln
- 1808 NE Burgandy Cir
- 1324 NE Burgandy Ln
- 1333 NE Burgandy Ln
- 1804 NE Burgandy Cir
- 1300 NE Burgandy Ln