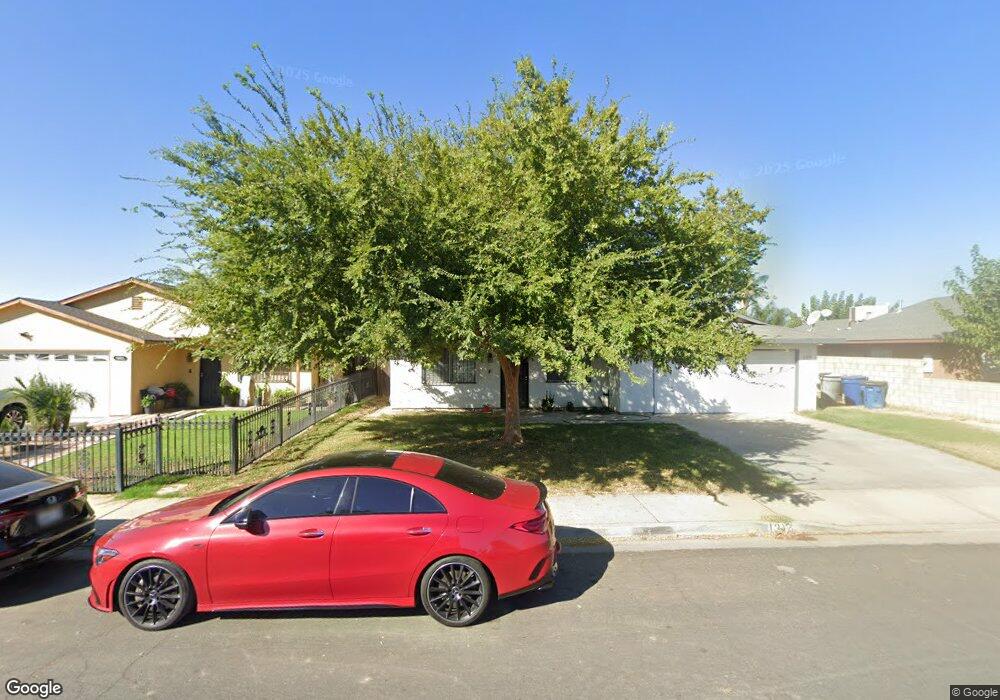
1317 Borel St Delano, CA 93215
West Delano NeighborhoodEstimated Value: $254,000 - $304,272
4
Beds
2
Baths
1,200
Sq Ft
$232/Sq Ft
Est. Value
About This Home
This home is located at 1317 Borel St, Delano, CA 93215 and is currently estimated at $278,318, approximately $231 per square foot. 1317 Borel St is a home located in Kern County with nearby schools including Fremont Elementary School, Almond Tree Middle School, and Robert F. Kennedy High School.
Ownership History
Date
Name
Owned For
Owner Type
Purchase Details
Closed on
Sep 20, 2008
Sold by
Adams Maureen
Bought by
Garcia Francisco
Current Estimated Value
Home Financials for this Owner
Home Financials are based on the most recent Mortgage that was taken out on this home.
Original Mortgage
$112,365
Interest Rate
6.37%
Mortgage Type
VA
Purchase Details
Closed on
Nov 3, 2004
Sold by
Adams Jonathan M and Adams Maureen
Bought by
Adams Maureen
Home Financials for this Owner
Home Financials are based on the most recent Mortgage that was taken out on this home.
Original Mortgage
$112,000
Interest Rate
8.1%
Mortgage Type
New Conventional
Purchase Details
Closed on
Jan 12, 2000
Sold by
Frial Marcelino and Frial Josefina
Bought by
Frial Maureen
Home Financials for this Owner
Home Financials are based on the most recent Mortgage that was taken out on this home.
Original Mortgage
$15,000
Interest Rate
7.84%
Mortgage Type
Stand Alone Second
Create a Home Valuation Report for This Property
The Home Valuation Report is an in-depth analysis detailing your home's value as well as a comparison with similar homes in the area
Home Values in the Area
Average Home Value in this Area
Purchase History
| Date | Buyer | Sale Price | Title Company |
|---|---|---|---|
| Garcia Francisco | $110,000 | Stewart Title Of California | |
| Adams Maureen | -- | Stewart Title | |
| Frial Maureen | $11,500 | Fidelity National Title Co |
Source: Public Records
Mortgage History
| Date | Status | Borrower | Loan Amount |
|---|---|---|---|
| Previous Owner | Garcia Francisco | $112,365 | |
| Previous Owner | Adams Maureen | $112,000 | |
| Previous Owner | Frial Maureen | $15,000 |
Source: Public Records
Tax History
| Year | Tax Paid | Tax Assessment Tax Assessment Total Assessment is a certain percentage of the fair market value that is determined by local assessors to be the total taxable value of land and additions on the property. | Land | Improvement |
|---|---|---|---|---|
| 2025 | $227 | $141,635 | $38,623 | $103,012 |
| 2024 | $218 | $138,859 | $37,866 | $100,993 |
| 2023 | $218 | $136,137 | $37,124 | $99,013 |
| 2022 | $208 | $133,469 | $36,397 | $97,072 |
| 2021 | $153 | $130,853 | $35,684 | $95,169 |
| 2020 | $131 | $129,513 | $35,319 | $94,194 |
| 2019 | $131 | $129,513 | $35,319 | $94,194 |
| 2018 | $131 | $124,487 | $33,949 | $90,538 |
| 2017 | $131 | $122,047 | $33,284 | $88,763 |
| 2016 | $1,563 | $119,655 | $32,632 | $87,023 |
| 2015 | $1,614 | $117,858 | $32,142 | $85,716 |
| 2014 | $1,510 | $115,550 | $31,513 | $84,037 |
Source: Public Records
Map
Nearby Homes
- 146 W 11th Place
- 142 W 11th Place
- 1942 Clinton St
- 1305 Los Olivos Way
- 441 14th Ave
- 814 Encanto Way
- 901 Belmont St
- 1417 Ellington St
- 1646 Clinton St
- 718 Florito Way
- 406 Calle de La Vina
- 725 Anita Ave Unit 5
- 1407 High St
- 1909 Albany St
- 622 Dover St
- 609 Dover St
- 334 Albany St
- 602 Dover Place
- 216 20th Ave
- 432 Dover Place
- 1311 Borel St
- 1323 Borel St
- 1316 Bordelais St
- 1322 Bordelais St
- 1310 Bordelais St
- 203 13th Ave
- 207 W 13th Ave
- 211 13th Ave
- 201 W 13th Place
- 207 W 13th Place
- 1311 Bordelais St
- 211 W 13th Place
- 147 13th Ave
- 215 W 13th Ave
- 221 W 13th Ave
- 1323 Bordelais St
- 143 13th Ave
- 1317 Bordelais St
- 217 W 13th Place
- 139 13th Ave
Your Personal Tour Guide
Ask me questions while you tour the home.