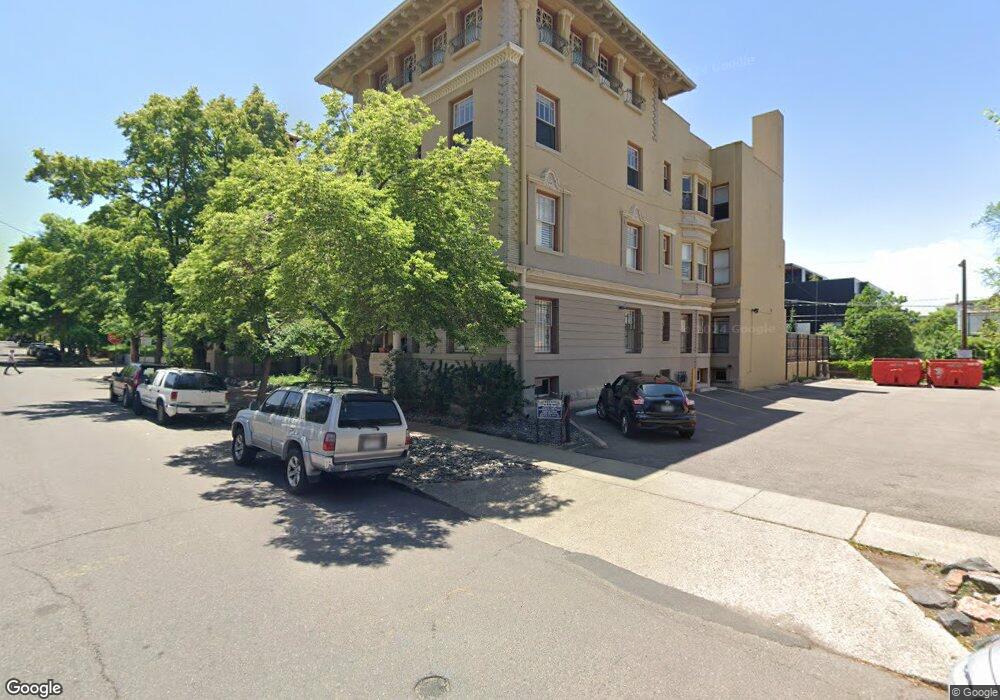
1317 Ogden St Unit 3 Denver, CO 80218
Capitol Hill NeighborhoodEstimated Value: $464,438 - $601,000
3
Beds
1
Bath
1,171
Sq Ft
$446/Sq Ft
Est. Value
About This Home
This home is located at 1317 Ogden St Unit 3, Denver, CO 80218 and is currently estimated at $522,360, approximately $446 per square foot. 1317 Ogden St Unit 3 is a home located in Denver County with nearby schools including Dora Moore ECE-8 School, Morey Middle School, and East High School.
Ownership History
Date
Name
Owned For
Owner Type
Purchase Details
Closed on
Mar 5, 2014
Sold by
Mccord Colleen A and Shield Bradford J
Bought by
Evelyn Ellorin Pieterick Living Trust
Current Estimated Value
Purchase Details
Closed on
Apr 25, 2003
Sold by
Mcconathy Jason
Bought by
Mccord Colleen A and Shield Bradford J
Home Financials for this Owner
Home Financials are based on the most recent Mortgage that was taken out on this home.
Original Mortgage
$223,000
Interest Rate
7.5%
Mortgage Type
Purchase Money Mortgage
Purchase Details
Closed on
May 27, 1998
Sold by
Meis Janet
Bought by
Mcconathy Jason
Home Financials for this Owner
Home Financials are based on the most recent Mortgage that was taken out on this home.
Original Mortgage
$124,000
Interest Rate
7%
Purchase Details
Closed on
May 19, 1995
Sold by
Tierney Douglas J
Bought by
Meis Janet
Home Financials for this Owner
Home Financials are based on the most recent Mortgage that was taken out on this home.
Original Mortgage
$54,000
Interest Rate
8.34%
Create a Home Valuation Report for This Property
The Home Valuation Report is an in-depth analysis detailing your home's value as well as a comparison with similar homes in the area
Home Values in the Area
Average Home Value in this Area
Purchase History
| Date | Buyer | Sale Price | Title Company |
|---|---|---|---|
| Evelyn Ellorin Pieterick Living Trust | $275,000 | Fidelity National Title Ins | |
| Mccord Colleen A | $223,000 | Land Title | |
| Mcconathy Jason | $125,000 | Land Title | |
| Meis Janet | $80,000 | -- |
Source: Public Records
Mortgage History
| Date | Status | Borrower | Loan Amount |
|---|---|---|---|
| Previous Owner | Mccord Colleen A | $223,000 | |
| Previous Owner | Mcconathy Jason | $124,000 | |
| Previous Owner | Meis Janet | $54,000 |
Source: Public Records
Tax History Compared to Growth
Tax History
| Year | Tax Paid | Tax Assessment Tax Assessment Total Assessment is a certain percentage of the fair market value that is determined by local assessors to be the total taxable value of land and additions on the property. | Land | Improvement |
|---|---|---|---|---|
| 2024 | $2,449 | $30,920 | $480 | $30,440 |
| 2023 | $2,396 | $30,920 | $480 | $30,440 |
| 2022 | $2,333 | $29,340 | $4,320 | $25,020 |
| 2021 | $2,253 | $30,190 | $4,450 | $25,740 |
| 2020 | $2,142 | $28,870 | $3,890 | $24,980 |
| 2019 | $2,082 | $28,870 | $3,890 | $24,980 |
| 2018 | $1,889 | $24,420 | $3,640 | $20,780 |
| 2017 | $1,884 | $24,420 | $3,640 | $20,780 |
| 2016 | $1,821 | $22,330 | $4,020 | $18,310 |
| 2015 | $1,745 | $22,330 | $4,020 | $18,310 |
| 2014 | $1,441 | $17,350 | $2,866 | $14,484 |
Source: Public Records
Map
Nearby Homes
- 1255 N Ogden St Unit 604
- 1255 N Ogden St Unit 305
- 1255 N Ogden St Unit 406
- 1255 N Ogden St Unit 605
- 1225 N Emerson St Unit B
- 1233 N Ogden St Unit 503
- 1233 N Ogden St Unit 312
- 1080 E 13th Ave Unit 403
- 1215 N Emerson St Unit A
- 1390 N Emerson St Unit 101
- 1390 N Emerson St Unit 407
- 1390 N Emerson St Unit 105
- 1374 N Ogden St Unit B
- 1116 E 13th Ave Unit D4
- 1024 E 14th Ave Unit 2
- 1024 E 14th Ave Unit 9
- 1243 N Washington St Unit 105
- 1243 N Washington St Unit 406
- 1243 N Washington St Unit 308
- 1351 N Washington St Unit 15
- 1317 Ogden St Unit 1317
- 1317 Ogden St Unit 1317
- 1317 Ogden St Unit 1317
- 1317 Ogden St
- 1317 Ogden St
- 1317 Ogden St Unit 1
- 1317 Ogden St Unit PT
- 1317 Ogden St Unit 5
- 1301 Ogden St Unit 1301
- 1301 Ogden St Unit 6
- 1301 Ogden St Unit 13015
- 1301 Ogden St Unit 1301
- 1301 Ogden St
- 1301 Ogden St
- 1301 Ogden St Unit 13012
- 1301 Ogden St Unit 1301
- 1301 Ogden St Unit 1301
- 1301 Ogden St Unit 1B
- 1301 Ogden St Unit 5
- 1301 Ogden St Unit 4