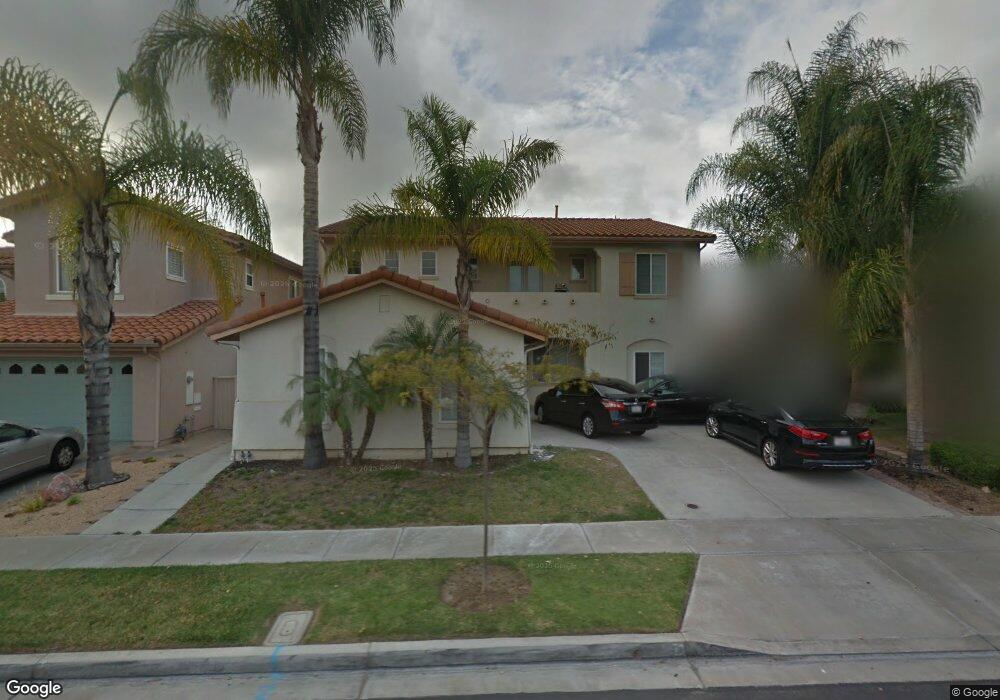
1317 Stanislaus Dr Chula Vista, CA 91913
Otay Ranch Village NeighborhoodEstimated Value: $1,117,992 - $1,215,000
4
Beds
3
Baths
2,973
Sq Ft
$395/Sq Ft
Est. Value
About This Home
This home is located at 1317 Stanislaus Dr, Chula Vista, CA 91913 and is currently estimated at $1,173,748, approximately $394 per square foot. 1317 Stanislaus Dr is a home located in San Diego County with nearby schools including Heritage Elementary School, Rancho Del Rey Middle School, and Otay Ranch Senior High School.
Ownership History
Date
Name
Owned For
Owner Type
Purchase Details
Closed on
Sep 20, 2000
Sold by
Su Dora
Bought by
Ambito Dora Su
Current Estimated Value
Home Financials for this Owner
Home Financials are based on the most recent Mortgage that was taken out on this home.
Original Mortgage
$252,700
Interest Rate
8.01%
Purchase Details
Closed on
Aug 1, 2000
Sold by
Shea Homes Ltd Partnership
Bought by
Vanbeaumont Roy W
Home Financials for this Owner
Home Financials are based on the most recent Mortgage that was taken out on this home.
Original Mortgage
$252,700
Interest Rate
8.01%
Purchase Details
Closed on
Jul 10, 2000
Sold by
Ambito Arnolfo B
Bought by
Su Dora
Home Financials for this Owner
Home Financials are based on the most recent Mortgage that was taken out on this home.
Original Mortgage
$252,700
Interest Rate
8.01%
Create a Home Valuation Report for This Property
The Home Valuation Report is an in-depth analysis detailing your home's value as well as a comparison with similar homes in the area
Home Values in the Area
Average Home Value in this Area
Purchase History
| Date | Buyer | Sale Price | Title Company |
|---|---|---|---|
| Ambito Dora Su | -- | First American Title | |
| Vanbeaumont Roy W | $336,500 | First American Title | |
| Su Dora | -- | First American Title |
Source: Public Records
Mortgage History
| Date | Status | Borrower | Loan Amount |
|---|---|---|---|
| Previous Owner | Vanbeaumont Roy W | $252,700 |
Source: Public Records
Tax History Compared to Growth
Tax History
| Year | Tax Paid | Tax Assessment Tax Assessment Total Assessment is a certain percentage of the fair market value that is determined by local assessors to be the total taxable value of land and additions on the property. | Land | Improvement |
|---|---|---|---|---|
| 2025 | $9,820 | $506,879 | $150,673 | $356,206 |
| 2024 | $9,820 | $496,941 | $147,719 | $349,222 |
| 2023 | $9,644 | $487,198 | $144,823 | $342,375 |
| 2022 | $9,381 | $477,646 | $141,984 | $335,662 |
| 2021 | $9,193 | $468,281 | $139,200 | $329,081 |
| 2020 | $8,990 | $463,480 | $137,773 | $325,707 |
| 2019 | $8,775 | $454,393 | $135,072 | $319,321 |
| 2018 | $8,618 | $445,484 | $132,424 | $313,060 |
| 2017 | $8,448 | $436,750 | $129,828 | $306,922 |
| 2016 | $8,145 | $428,187 | $127,283 | $300,904 |
| 2015 | $7,914 | $421,757 | $125,372 | $296,385 |
| 2014 | $7,705 | $413,497 | $122,917 | $290,580 |
Source: Public Records
Map
Nearby Homes
- 1209 Morgan Hill Dr
- 1340 Monte Sereno Ave
- 1284 Saint Helena Ave
- 1402 Antioch Ave
- 1236 El Cortez Ct
- 1411 Santa Rita E
- 1181 De Soto Ct Unit 54
- 1377 Stoney Spring Ct
- 1175 Santa Olivia Rd
- 1156 Tristan River Rd
- 1236 Bolinas Bay Ct
- 1272 Santa Lucia Rd
- 1518 Piedmont St
- 1075 Hayuco Plaza
- 1060 Via Sinuoso
- 1532 Painted Cave Ave
- 1631 Applegate St
- 1457 Carpinteria St
- 1057 Paseo Del Norte
- 1781 Camino Strava Unit 1
- 1313 Stanislaus Dr
- 1321 Stanislaus Dr
- 1325 Stanislaus Dr
- 1309 Stanislaus Dr
- 1285 Monte Sereno Ave
- 1281 Monte Sereno Ave
- 1289 Monte Sereno Ave
- 1277 Monte Sereno Ave
- 1305 Stanislaus Dr
- 1329 Stanislaus Dr
- 1312 Stanislaus Dr
- 1318 Stanislaus Dr
- 1293 Monte Sereno Ave
- 1308 Stanislaus Dr
- 1324 Stanislaus Dr
- 1273 Monte Sereno Ave
- 1333 Stanislaus Dr
- 1297 Monte Sereno Ave
- 1304 Stanislaus Dr
- 1301 Stanislaus Dr