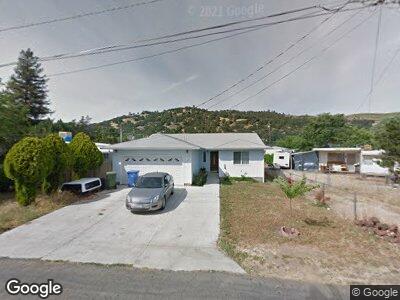
13188 Fourth St Clearlake Oaks, CA 95423
Estimated Value: $278,000 - $288,015
3
Beds
2
Baths
1,647
Sq Ft
$173/Sq Ft
Est. Value
About This Home
This home is located at 13188 Fourth St, Clearlake Oaks, CA 95423 and is currently estimated at $284,504, approximately $172 per square foot. 13188 Fourth St is a home located in Lake County with nearby schools including Lower Lake High School.
Ownership History
Date
Name
Owned For
Owner Type
Purchase Details
Closed on
Mar 16, 2017
Sold by
Barnett David
Bought by
Barnett David and Barnett Janet
Current Estimated Value
Home Financials for this Owner
Home Financials are based on the most recent Mortgage that was taken out on this home.
Original Mortgage
$112,000
Interest Rate
4.17%
Mortgage Type
New Conventional
Purchase Details
Closed on
Sep 23, 2009
Sold by
Federal Home Loan Mortgage Corporation
Bought by
Barnett David
Home Financials for this Owner
Home Financials are based on the most recent Mortgage that was taken out on this home.
Original Mortgage
$123,717
Interest Rate
5%
Mortgage Type
FHA
Purchase Details
Closed on
Jul 24, 2009
Sold by
Compton John A
Bought by
Federal Home Loan Mortgage Corporation
Purchase Details
Closed on
Feb 10, 2005
Sold by
Prime Pacific
Bought by
Compton John A
Create a Home Valuation Report for This Property
The Home Valuation Report is an in-depth analysis detailing your home's value as well as a comparison with similar homes in the area
Home Values in the Area
Average Home Value in this Area
Purchase History
| Date | Buyer | Sale Price | Title Company |
|---|---|---|---|
| Barnett David | -- | First American Title Company | |
| Barnett David | $126,000 | Ticor Title | |
| Federal Home Loan Mortgage Corporation | $105,417 | Accommodation | |
| Compton John A | $24,826 | -- |
Source: Public Records
Mortgage History
| Date | Status | Borrower | Loan Amount |
|---|---|---|---|
| Open | Barnett David | $172,000 | |
| Closed | Barnett David | $30,000 | |
| Closed | Barnett David | $112,000 | |
| Closed | Barnett David | $122,530 | |
| Closed | Barnett David | $123,717 | |
| Previous Owner | Compton John A | $200,000 |
Source: Public Records
Tax History Compared to Growth
Tax History
| Year | Tax Paid | Tax Assessment Tax Assessment Total Assessment is a certain percentage of the fair market value that is determined by local assessors to be the total taxable value of land and additions on the property. | Land | Improvement |
|---|---|---|---|---|
| 2024 | $1,790 | $159,062 | $44,181 | $114,881 |
| 2023 | $1,769 | $155,944 | $43,315 | $112,629 |
| 2022 | $1,683 | $152,887 | $42,466 | $110,421 |
| 2021 | $1,783 | $149,890 | $41,634 | $108,256 |
| 2020 | $1,774 | $148,354 | $41,208 | $107,146 |
| 2019 | $1,700 | $145,446 | $40,400 | $105,046 |
| 2018 | $1,701 | $142,595 | $39,608 | $102,987 |
| 2017 | $1,572 | $139,800 | $38,832 | $100,968 |
| 2016 | $1,502 | $137,060 | $38,071 | $98,989 |
| 2015 | -- | $135,003 | $37,500 | $97,503 |
| 2014 | -- | $132,360 | $36,766 | $95,594 |
Source: Public Records
Map
Nearby Homes
- 13169 3rd St
- 13145 4th St
- 13104 4th St
- 13084 4th St
- 13330 1st St
- 13321 Anchor Village
- 13171 Ebbtide Village
- 565 Bass Ln
- 13418 Marina Village
- 65 Butler St
- 12967 2nd St
- 13344 Venus Village
- 588 Pebble Way
- 613 Bass Ln
- 13373 Venus Village
- 13488 Marina Village
- 12940 1st St
- 601 Bass Ln
- 12856 3rd St
- 12860 2nd St
- 13188 Fourth St
- 13189 Third St
- 13189 3rd St
- 13179 3rd St
- 13193 3rd St
- 13199 Driftwood Village
- 13199 Driftwood Village
- 13160 Ebbtide Village
- 13252 3rd St
- 13149 3rd St
- 286 Hoover St
- 13168 Ebbtide Village
- 13262 Third
- 13178 Ebbtide Village
- 13130 5th St
- 13227 Driftwood Village
- 13228 Driftwood Village
- 13180 Ebbtide Village
- 285 Hoover St
- 13115 4th St