Estimated Value: $1,284,000 - $1,420,000
5
Beds
2
Baths
1,930
Sq Ft
$700/Sq Ft
Est. Value
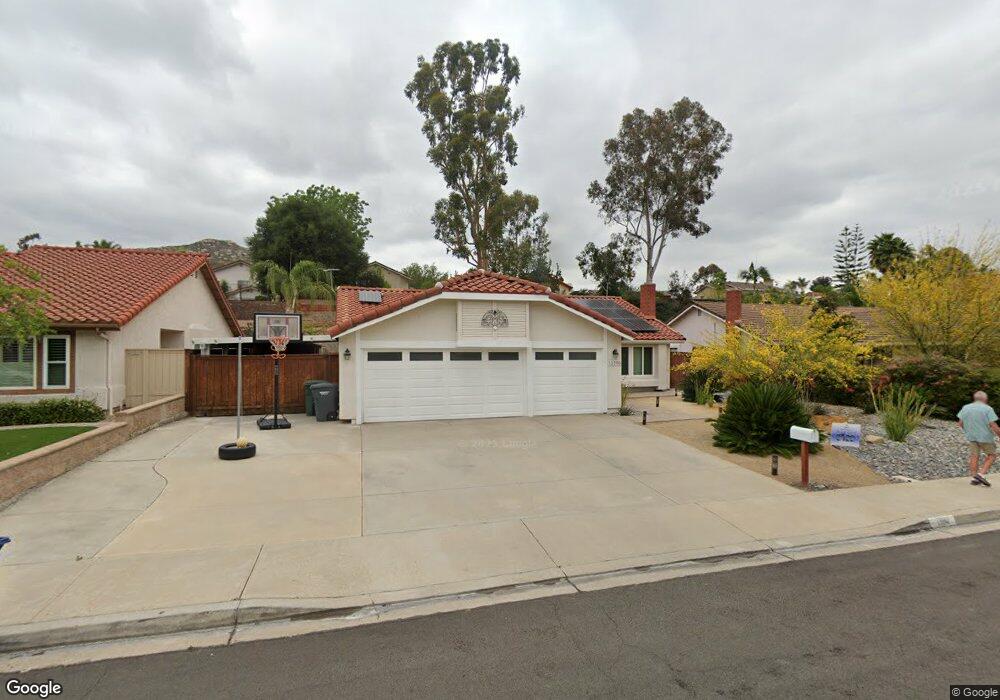
About This Home
This home is located at 13196 Treecrest St, Poway, CA 92064 and is currently estimated at $1,350,917, approximately $699 per square foot. 13196 Treecrest St is a home located in San Diego County with nearby schools including Tierra Bonita Elementary, Twin Peaks Middle, and Poway High.
Ownership History
Date
Name
Owned For
Owner Type
Purchase Details
Closed on
Jan 23, 2017
Sold by
Singh Giselle E
Bought by
Singh Naipaul
Current Estimated Value
Home Financials for this Owner
Home Financials are based on the most recent Mortgage that was taken out on this home.
Original Mortgage
$587,200
Outstanding Balance
$485,007
Interest Rate
4.2%
Mortgage Type
New Conventional
Estimated Equity
$865,910
Purchase Details
Closed on
Jan 20, 2017
Sold by
Cartus Financial Corporation
Bought by
Singh Naipaul
Home Financials for this Owner
Home Financials are based on the most recent Mortgage that was taken out on this home.
Original Mortgage
$587,200
Outstanding Balance
$485,007
Interest Rate
4.2%
Mortgage Type
New Conventional
Estimated Equity
$865,910
Purchase Details
Closed on
Jan 13, 2017
Sold by
Nelthorpe Ronald and Nelthorpe Robin
Bought by
Cartus Financial Corporation
Home Financials for this Owner
Home Financials are based on the most recent Mortgage that was taken out on this home.
Original Mortgage
$587,200
Outstanding Balance
$485,007
Interest Rate
4.2%
Mortgage Type
New Conventional
Estimated Equity
$865,910
Purchase Details
Closed on
Jan 23, 2014
Sold by
Fahlsing Kathleen L
Bought by
Nelthorpe Ronald and Nelthorpe Robin
Home Financials for this Owner
Home Financials are based on the most recent Mortgage that was taken out on this home.
Original Mortgage
$546,250
Interest Rate
4.13%
Mortgage Type
New Conventional
Purchase Details
Closed on
Sep 9, 2013
Sold by
Fahlsing Kathleen L and Fahlsing Kathleen
Bought by
Fahlsing Kathleen L
Home Financials for this Owner
Home Financials are based on the most recent Mortgage that was taken out on this home.
Original Mortgage
$234,745
Interest Rate
4.53%
Mortgage Type
New Conventional
Purchase Details
Closed on
Sep 24, 2009
Sold by
Fahlsing Kathleen L
Bought by
Fahlsing Kathleen
Home Financials for this Owner
Home Financials are based on the most recent Mortgage that was taken out on this home.
Original Mortgage
$253,000
Interest Rate
5.02%
Mortgage Type
New Conventional
Purchase Details
Closed on
Jun 9, 2005
Sold by
Fahlsing Kevin and Fahlsing Kathleen
Bought by
Fahlsing Kevin C and Fahlsing Kathleen L
Purchase Details
Closed on
Aug 13, 1999
Sold by
Yanke and Diana
Bought by
Fahlsing Kevin and Fahlsing Kathleen
Home Financials for this Owner
Home Financials are based on the most recent Mortgage that was taken out on this home.
Original Mortgage
$240,000
Interest Rate
7.66%
Purchase Details
Closed on
Aug 21, 1989
Purchase Details
Closed on
Apr 16, 1984
Create a Home Valuation Report for This Property
The Home Valuation Report is an in-depth analysis detailing your home's value as well as a comparison with similar homes in the area
Home Values in the Area
Average Home Value in this Area
Purchase History
| Date | Buyer | Sale Price | Title Company |
|---|---|---|---|
| Singh Naipaul | -- | Equity Title | |
| Singh Naipaul | $734,000 | Equity Title | |
| Cartus Financial Corporation | $213,000 | Equity Title | |
| Nelthorpe Ronald | $689,000 | First American Title Company | |
| Fahlsing Kathleen L | -- | None Available | |
| Fahlsing Kathleen | -- | Corinthian Title Company | |
| Fahlsing Kevin C | -- | -- | |
| Fahlsing Kevin | $308,500 | Old Republic Title Company | |
| -- | $268,000 | -- | |
| -- | $137,000 | -- |
Source: Public Records
Mortgage History
| Date | Status | Borrower | Loan Amount |
|---|---|---|---|
| Open | Singh Naipaul | $587,200 | |
| Previous Owner | Nelthorpe Ronald | $546,250 | |
| Previous Owner | Fahlsing Kathleen L | $234,745 | |
| Previous Owner | Fahlsing Kathleen | $253,000 | |
| Previous Owner | Fahlsing Kevin | $240,000 | |
| Closed | Fahlsing Kevin | $15,000 |
Source: Public Records
Tax History
| Year | Tax Paid | Tax Assessment Tax Assessment Total Assessment is a certain percentage of the fair market value that is determined by local assessors to be the total taxable value of land and additions on the property. | Land | Improvement |
|---|---|---|---|---|
| 2025 | $9,903 | $881,390 | $395,831 | $485,559 |
| 2024 | $9,903 | $864,109 | $388,070 | $476,039 |
| 2023 | $9,696 | $847,166 | $380,461 | $466,705 |
| 2022 | $9,538 | $830,555 | $373,001 | $457,554 |
| 2021 | $9,416 | $814,271 | $365,688 | $448,583 |
| 2020 | $9,292 | $805,923 | $361,939 | $443,984 |
| 2019 | $8,758 | $763,651 | $354,843 | $408,808 |
| 2018 | $8,516 | $748,679 | $347,886 | $400,793 |
| 2017 | $7,991 | $713,495 | $331,537 | $381,958 |
| 2016 | $7,829 | $699,506 | $325,037 | $374,469 |
| 2015 | $7,715 | $689,000 | $320,155 | $368,845 |
| 2014 | $4,753 | $421,423 | $195,821 | $225,602 |
Source: Public Records
Map
Nearby Homes
- 14725 Fieldview Way
- 13303 Betty Lee Way
- 13730 Holly Oak Way
- 12885 Rockwell Ct
- 14403 Gaslight Ct
- 14109 Arbolitos Dr
- 13780 Holly Oak Way
- 13765 Holly Oak Way
- 14015 Olive Meadows Place
- 14127 Tobiasson Rd
- 15032 Heath Dr
- 13908 Hibiscus Ave Unit 40
- 13941 Wisteria Ave
- 13483 Pequot Dr
- 13972 Poway Valley Rd
- 13619 Sycamore Tree Ln
- 14963 Huntington Gate Dr Unit 2
- 13622 Utopia Rd
- 13650 Mulberry Tree Ct Unit 167
- 12708 Casa Avenida
- 13194 Treecrest St
- 13198 Treecrest St
- 13192 Treecrest St
- 13175 Triumph Dr
- 13222 Treecrest St
- 13165 Triumph Dr
- 13185 Triumph Dr
- 13197 Treecrest St
- 13155 Triumph Dr
- 13195 Triumph Dr
- 13190 Treecrest St
- 13199 Treecrest St
- 13195 Treecrest St
- 13232 Treecrest St
- 13193 Treecrest St
- 13217 Treecrest St
- 13145 Triumph Dr
- 13199 Triumph Dr
- 13188 Treecrest St
- 13191 Treecrest St
Your Personal Tour Guide
Ask me questions while you tour the home.