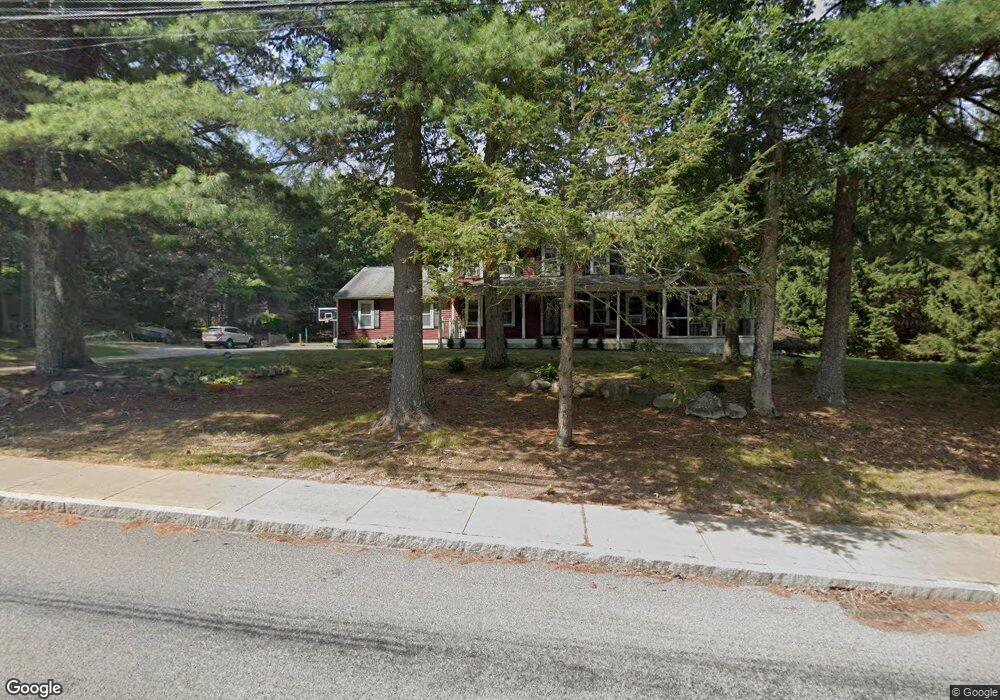
132 Forest St Franklin, MA 02038
Wadsworth NeighborhoodEstimated Value: $932,960 - $1,060,000
4
Beds
3
Baths
2,900
Sq Ft
$341/Sq Ft
Est. Value
About This Home
This home is located at 132 Forest St, Franklin, MA 02038 and is currently estimated at $989,990, approximately $341 per square foot. 132 Forest St is a home located in Norfolk County with nearby schools including Jefferson Elementary School, Remington Middle School, and Franklin High School.
Ownership History
Date
Name
Owned For
Owner Type
Purchase Details
Closed on
Feb 23, 2007
Sold by
Macdonald Laurence W and Macdonald Susan G
Bought by
Miller Erin and Miller Ernest
Current Estimated Value
Purchase Details
Closed on
Sep 21, 1993
Sold by
Est Carr Edward J and Carr Barbara A
Bought by
Macdonald Laurence W and Macdonald Susan G
Create a Home Valuation Report for This Property
The Home Valuation Report is an in-depth analysis detailing your home's value as well as a comparison with similar homes in the area
Home Values in the Area
Average Home Value in this Area
Purchase History
| Date | Buyer | Sale Price | Title Company |
|---|---|---|---|
| Miller Erin | $515,000 | -- | |
| Macdonald Laurence W | $205,000 | -- |
Source: Public Records
Mortgage History
| Date | Status | Borrower | Loan Amount |
|---|---|---|---|
| Open | Macdonald Laurence W | $403,200 | |
| Closed | Macdonald Laurence W | $408,669 |
Source: Public Records
Tax History
| Year | Tax Paid | Tax Assessment Tax Assessment Total Assessment is a certain percentage of the fair market value that is determined by local assessors to be the total taxable value of land and additions on the property. | Land | Improvement |
|---|---|---|---|---|
| 2025 | $9,784 | $842,000 | $249,400 | $592,600 |
| 2024 | $8,396 | $712,100 | $249,400 | $462,700 |
| 2023 | $8,459 | $672,400 | $251,500 | $420,900 |
| 2022 | $8,145 | $579,700 | $207,900 | $371,800 |
| 2021 | $7,634 | $521,100 | $222,700 | $298,400 |
| 2020 | $7,381 | $508,700 | $224,700 | $284,000 |
| 2019 | $7,142 | $487,200 | $203,500 | $283,700 |
| 2018 | $6,801 | $464,200 | $209,300 | $254,900 |
| 2017 | $6,516 | $446,900 | $192,000 | $254,900 |
| 2016 | $6,141 | $423,500 | $188,900 | $234,600 |
| 2015 | $6,216 | $418,900 | $184,300 | $234,600 |
| 2014 | $5,628 | $389,500 | $154,900 | $234,600 |
Source: Public Records
Map
Nearby Homes
- 9 Reagan Ave
- 955 Summer St
- 0 Fall Ln
- 18 Bubbling Brook Rd
- 900 Washington St Lot 2
- 1620 West St
- 1 Washington St
- 3 Washington St
- 10 Follett Dr
- 1565 West St
- 374-378 Union St
- 925 Washington St
- 440 Chestnut St
- 139 King St Unit 306
- 60 Grant Ave
- 99 Summer St
- 82 Uncas Ave
- 82 Uncas Ave Unit 1
- 80 Uncas Ave
- 76 Uncas Ave
Your Personal Tour Guide
Ask me questions while you tour the home.