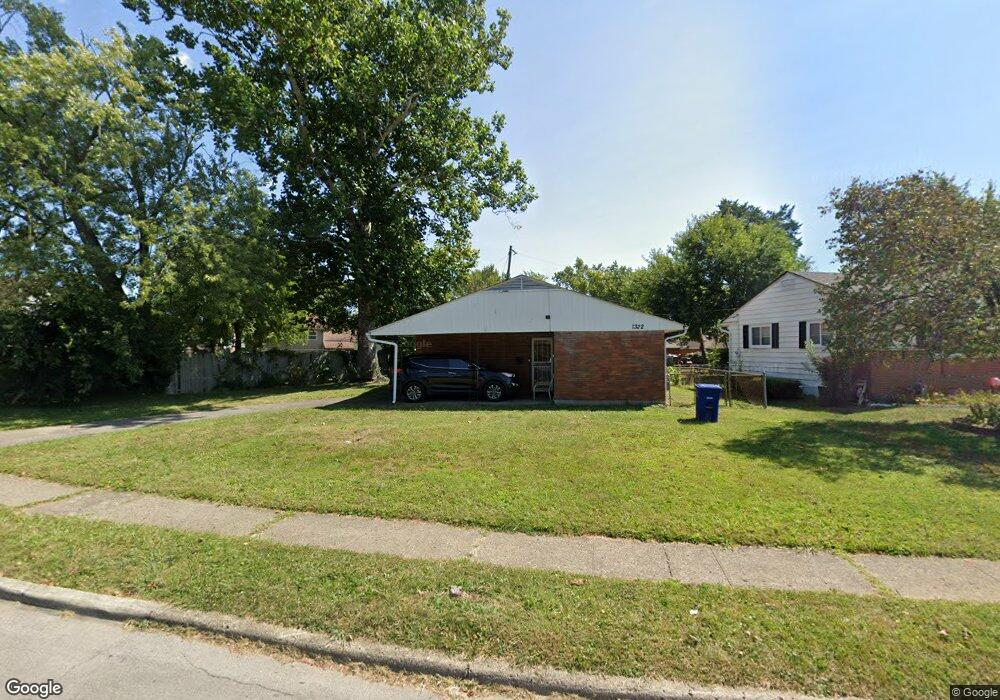
1322 Coburg Rd Columbus, OH 43227
Linwood NeighborhoodEstimated Value: $186,345 - $249,000
3
Beds
2
Baths
1,252
Sq Ft
$174/Sq Ft
Est. Value
About This Home
This home is located at 1322 Coburg Rd, Columbus, OH 43227 and is currently estimated at $217,836, approximately $173 per square foot. 1322 Coburg Rd is a home located in Franklin County with nearby schools including Scottwood Elementary School, Johnson Park Middle School, and Walnut Ridge High School.
Ownership History
Date
Name
Owned For
Owner Type
Purchase Details
Closed on
Dec 10, 2009
Sold by
Low William S
Bought by
Cook Carolyn Y
Current Estimated Value
Home Financials for this Owner
Home Financials are based on the most recent Mortgage that was taken out on this home.
Original Mortgage
$65,687
Outstanding Balance
$42,845
Interest Rate
4.9%
Mortgage Type
FHA
Estimated Equity
$174,991
Purchase Details
Closed on
Mar 3, 2009
Sold by
Secretary Of Housing & Urban Development
Bought by
Low William S
Home Financials for this Owner
Home Financials are based on the most recent Mortgage that was taken out on this home.
Original Mortgage
$62,080
Interest Rate
5.09%
Mortgage Type
Future Advance Clause Open End Mortgage
Purchase Details
Closed on
Mar 14, 2008
Sold by
Medley Vivian and Chase Home Finance Llc
Bought by
Hud
Purchase Details
Closed on
Feb 21, 2003
Sold by
Chappelear Walter F and Chappelear Constance
Bought by
Medley Vivian and Earley Channie
Purchase Details
Closed on
Oct 5, 1993
Bought by
Chappelear Walter F
Purchase Details
Closed on
Jan 22, 1991
Purchase Details
Closed on
Nov 27, 1990
Create a Home Valuation Report for This Property
The Home Valuation Report is an in-depth analysis detailing your home's value as well as a comparison with similar homes in the area
Home Values in the Area
Average Home Value in this Area
Purchase History
| Date | Buyer | Sale Price | Title Company |
|---|---|---|---|
| Cook Carolyn Y | $66,900 | Attorney | |
| Low William S | $16,600 | Lakeside Ti | |
| Hud | $54,000 | None Available | |
| Medley Vivian | $81,900 | Amerititle Agency Inc | |
| Chappelear Walter F | $46,900 | -- | |
| -- | -- | -- | |
| -- | -- | -- |
Source: Public Records
Mortgage History
| Date | Status | Borrower | Loan Amount |
|---|---|---|---|
| Open | Cook Carolyn Y | $65,687 | |
| Previous Owner | Low William S | $62,080 |
Source: Public Records
Tax History Compared to Growth
Tax History
| Year | Tax Paid | Tax Assessment Tax Assessment Total Assessment is a certain percentage of the fair market value that is determined by local assessors to be the total taxable value of land and additions on the property. | Land | Improvement |
|---|---|---|---|---|
| 2024 | $2,154 | $47,990 | $13,300 | $34,690 |
| 2023 | $2,126 | $47,985 | $13,300 | $34,685 |
| 2022 | $1,287 | $24,820 | $7,880 | $16,940 |
| 2021 | $1,290 | $24,820 | $7,880 | $16,940 |
| 2020 | $1,291 | $24,820 | $7,880 | $16,940 |
| 2019 | $1,247 | $20,550 | $6,580 | $13,970 |
| 2018 | $1,208 | $20,550 | $6,580 | $13,970 |
| 2017 | $1,246 | $20,550 | $6,580 | $13,970 |
| 2016 | $1,292 | $19,500 | $5,390 | $14,110 |
| 2015 | $1,173 | $19,500 | $5,390 | $14,110 |
| 2014 | $1,175 | $19,500 | $5,390 | $14,110 |
| 2013 | $644 | $21,665 | $5,985 | $15,680 |
Source: Public Records
Map
Nearby Homes
- 3566 Seabrook Ave
- 1271 S Weyant Ave
- 3563 Astor Ave
- 3325 Towers Ct S
- 3339 Towers Ct N
- 3598 Astor Ave
- 1664 Barnett Rd
- 1624 Miltwood Rd
- 3246 E Deshler Ave
- 3084 Clermont Rd
- 3325 E Deshler Ave
- 1054 S Hampton Rd
- 1252 Carolwood Ave
- 1294 Dellwood Ave
- 892 Ruby Ave
- 931 E Fulton St
- 891 S Weyant Ave Unit 893
- 1048 S James Rd
- 1077-1079 S James Rd
- 1836 Penfield Ct S