
Seller's Agent in 2024
Oumar Bah
Bah Realty Trust
(202) 421-5863
2 in this area
33 Total Sales
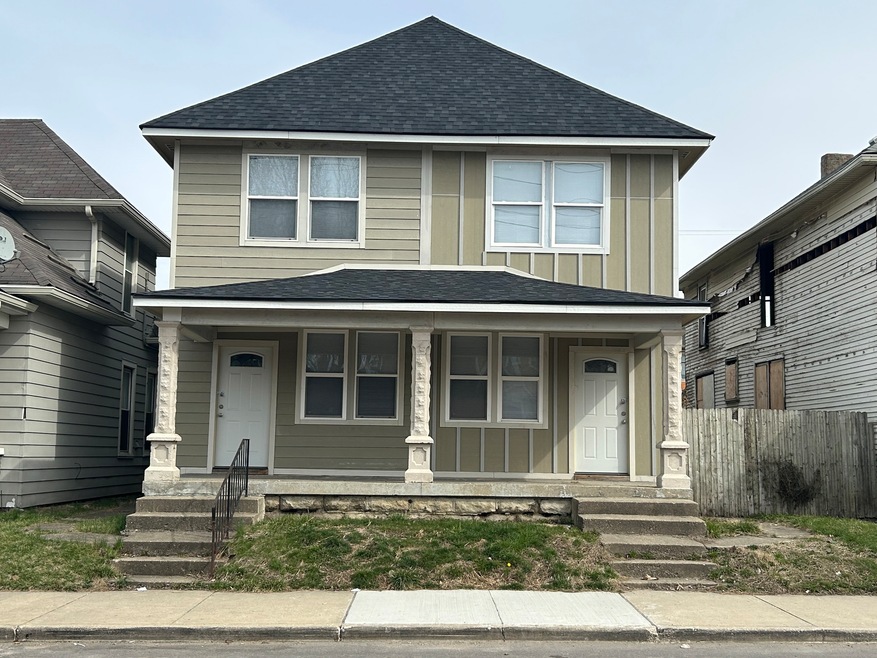
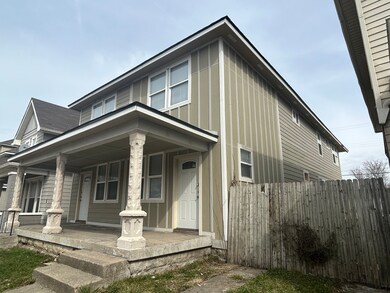
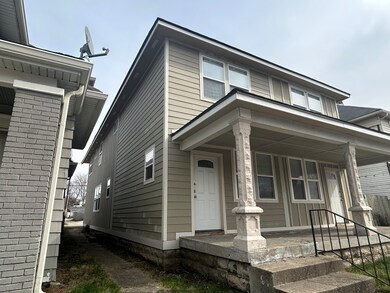
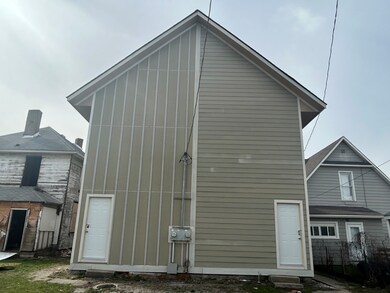
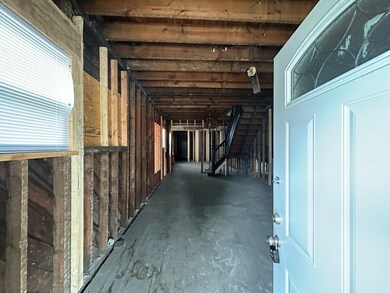
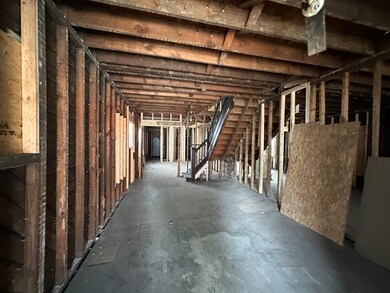
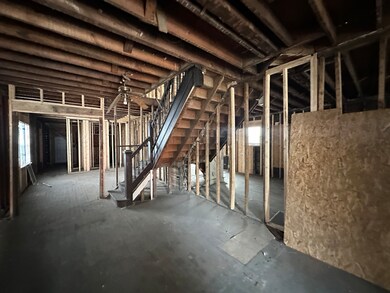
The exterior has been updated with new siding, new paint, new windows, new doors. newer roof. The side Absolutely beautiful exterior. The interior has been gutted to the studs and studs replaced. It is ready for the next steps of construction. 2 story duplex with 2 bedrooms, 2 baths per unit. Nice big room sizes. Great floor plan. Near Eli Lilly.
Last Agent to Sell the Property
Christina Goff
New Opportunities Realty Brokerage Email: Christina.marie.goff@gmail.com Listed on: 08/13/2023
| Date | Type | Sale Price | Title Company |
|---|---|---|---|
| Warranty Deed | $600,000 | Centurion Land Title | |
| Warranty Deed | -- | Centurion Land Title | |
| Warranty Deed | $600,000 | Centurion Land Title | |
| Warranty Deed | $247,500 | Centurion Land Title | |
| Warranty Deed | -- | Title Solutions | |
| Warranty Deed | -- | Title Solutions | |
| Warranty Deed | -- | Title Solutions | |
| Warranty Deed | -- | None Listed On Document | |
| Warranty Deed | $400,000 | None Available | |
| Warranty Deed | -- | None Available | |
| Deed | $135,000 | -- | |
| Deed | $135,000 | Meridian Title Corporation | |
| Deed | $12,000 | Eagle Land Title | |
| Deed | $59,900 | Eagle Land Title | |
| Warranty Deed | -- | None Available | |
| Warranty Deed | -- | None Available |
| Date | Status | Loan Amount | Loan Type |
|---|---|---|---|
| Open | $589,132 | FHA | |
| Closed | $589,132 | FHA | |
| Closed | $589,132 | FHA | |
| Previous Owner | $367,550 | Construction | |
| Previous Owner | $195,000 | Construction | |
| Previous Owner | $195,000 | New Conventional | |
| Previous Owner | $195,000 | Construction | |
| Previous Owner | $392,000 | New Conventional | |
| Previous Owner | $314,880 | New Conventional | |
| Previous Owner | $423,000 | Commercial | |
| Previous Owner | $191,680 | Future Advance Clause Open End Mortgage |
| Date | Event | Price | Change | Sq Ft Price |
|---|---|---|---|---|
| 06/14/2024 06/14/24 | Sold | $600,000 | -4.8% | $435 / Sq Ft |
| 04/21/2024 04/21/24 | Pending | -- | -- | -- |
| 04/16/2024 04/16/24 | For Sale | $630,000 | +154.5% | $457 / Sq Ft |
| 12/01/2023 12/01/23 | Sold | $247,500 | -11.6% | $179 / Sq Ft |
| 08/27/2023 08/27/23 | Pending | -- | -- | -- |
| 08/15/2023 08/15/23 | For Sale | $280,000 | +13.1% | $203 / Sq Ft |
| 08/14/2023 08/14/23 | Off Market | $247,500 | -- | -- |
| 08/13/2023 08/13/23 | For Sale | $280,000 | +100.0% | $203 / Sq Ft |
| 03/26/2023 03/26/23 | Sold | $140,000 | -6.6% | $101 / Sq Ft |
| 03/15/2023 03/15/23 | For Sale | $149,900 | -- | $108 / Sq Ft |
| Year | Tax Paid | Tax Assessment Tax Assessment Total Assessment is a certain percentage of the fair market value that is determined by local assessors to be the total taxable value of land and additions on the property. | Land | Improvement |
|---|---|---|---|---|
| 2024 | $8,331 | $180,000 | $19,000 | $161,000 |
| 2023 | $8,331 | $345,400 | $38,000 | $307,400 |
| 2022 | $17,504 | $195,600 | $38,000 | $157,600 |
| 2021 | $6,202 | $178,800 | $38,000 | $140,800 |
| 2020 | $3,892 | $162,400 | $38,000 | $124,400 |
| 2019 | $3,526 | $143,900 | $4,100 | $139,800 |
| 2018 | $2,935 | $88,100 | $4,100 | $84,000 |
| 2017 | $5,359 | $80,500 | $4,100 | $76,400 |
| 2016 | $1,636 | $72,900 | $4,100 | $68,800 |
| 2014 | $1,425 | $65,900 | $4,100 | $61,800 |
| 2013 | $1,370 | $65,900 | $4,100 | $61,800 |
Seller's Agent in 2024
Oumar Bah
Bah Realty Trust
(202) 421-5863
2 in this area
33 Total Sales
K
Buyer's Agent in 2024
Krystal Maldonado
eXp Realty LLC
(845) 341-3411
1 in this area
79 Total Sales
C
Seller's Agent in 2023
Christina Goff
New Opportunities Realty
J
Seller's Agent in 2023
Joey Gaard
Pocket Property, LLC
(317) 258-0147
3 in this area
48 Total Sales
Source: MIBOR Broker Listing Cooperative®
MLS Number: 21936984
APN: 49-11-13-184-033.000-101
Disclaimer: Certain information contained herein is derived from information provided by parties other than Homes.com. All information provided is deemed reliable, but is not guaranteed to be accurate and should be independently verified.
![]() Based on information submitted to the MLS GRID. All data is obtained from various sources and may not have been verified by broker or MLS GRID. Supplied Open House Information is subject to change without notice. All information should be independently reviewed and verified for accuracy. Properties may or may not be listed by the office/agent presenting the information. Some IDX listings have been excluded from this website.
Based on information submitted to the MLS GRID. All data is obtained from various sources and may not have been verified by broker or MLS GRID. Supplied Open House Information is subject to change without notice. All information should be independently reviewed and verified for accuracy. Properties may or may not be listed by the office/agent presenting the information. Some IDX listings have been excluded from this website.