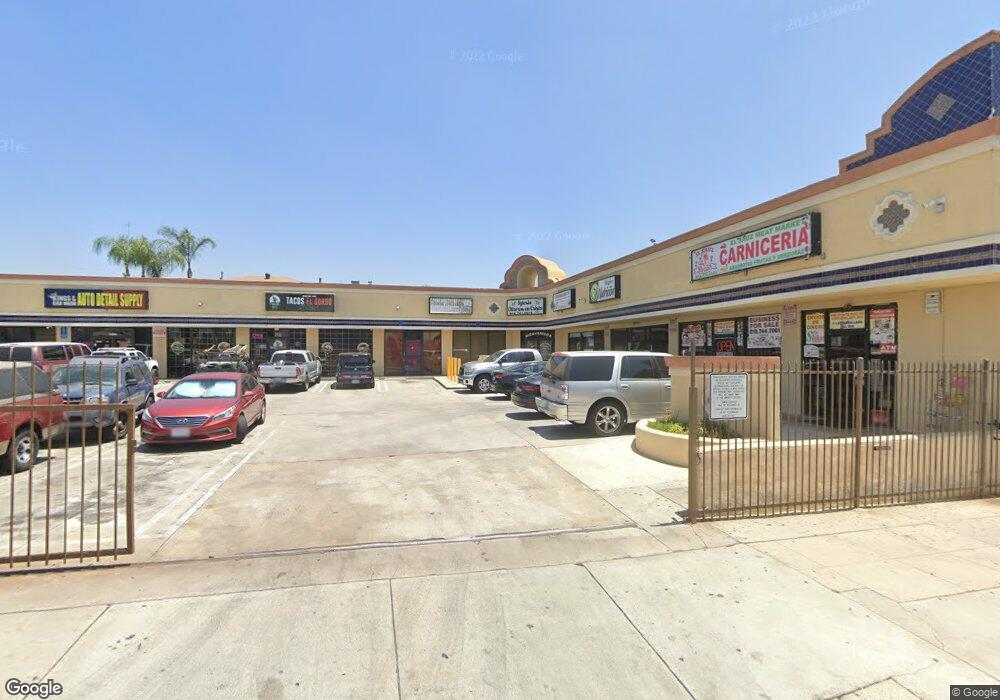
13236 Paxton St Unit 3 Los Angeles, CA 91331
Estimated Value: $3,374,550
--
Bed
--
Bath
10,016
Sq Ft
$337/Sq Ft
Est. Value
About This Home
This home is located at 13236 Paxton St Unit 3, Los Angeles, CA 91331 and is currently priced at $3,374,550, approximately $336 per square foot. 13236 Paxton St Unit 3 is a home located in Los Angeles County with nearby schools including Charles Maclay Middle School, San Fernando Senior High School, and Pacoima Charter Elementary School.
Ownership History
Date
Name
Owned For
Owner Type
Purchase Details
Closed on
Feb 27, 2006
Sold by
National Exchange Advisors Galtier Llc
Bought by
Goodrich Michael M and Goodrich Shari E
Current Estimated Value
Home Financials for this Owner
Home Financials are based on the most recent Mortgage that was taken out on this home.
Original Mortgage
$875,000
Outstanding Balance
$490,708
Interest Rate
6.04%
Mortgage Type
Commercial
Purchase Details
Closed on
Dec 15, 2005
Sold by
Paxton Plaza Llc
Bought by
National Exchange Advisors Galtier Llc
Purchase Details
Closed on
Jul 25, 2003
Sold by
Machhour Yousef and Alnakoud Barakat
Bought by
Paxton Plaza Llc
Purchase Details
Closed on
Oct 20, 1997
Sold by
Alnakoud Yusra Rateb
Bought by
Alnakoud Barakat
Home Financials for this Owner
Home Financials are based on the most recent Mortgage that was taken out on this home.
Original Mortgage
$200,000
Interest Rate
7.33%
Mortgage Type
Commercial
Create a Home Valuation Report for This Property
The Home Valuation Report is an in-depth analysis detailing your home's value as well as a comparison with similar homes in the area
Home Values in the Area
Average Home Value in this Area
Purchase History
| Date | Buyer | Sale Price | Title Company |
|---|---|---|---|
| Goodrich Michael M | $2,100,000 | California Title Company | |
| National Exchange Advisors Galtier Llc | -- | California Title Company | |
| Paxton Plaza Llc | $1,035,000 | California Title Company | |
| Alnakoud Barakat | -- | United Title |
Source: Public Records
Mortgage History
| Date | Status | Borrower | Loan Amount |
|---|---|---|---|
| Open | Goodrich Michael M | $875,000 | |
| Previous Owner | Alnakoud Barakat | $200,000 |
Source: Public Records
Tax History Compared to Growth
Tax History
| Year | Tax Paid | Tax Assessment Tax Assessment Total Assessment is a certain percentage of the fair market value that is determined by local assessors to be the total taxable value of land and additions on the property. | Land | Improvement |
|---|---|---|---|---|
| 2025 | $35,427 | $2,869,819 | $1,291,416 | $1,578,403 |
| 2024 | $35,427 | $2,813,549 | $1,266,095 | $1,547,454 |
| 2023 | $34,757 | $2,758,382 | $1,241,270 | $1,517,112 |
| 2022 | $33,177 | $2,704,297 | $1,216,932 | $1,487,365 |
| 2021 | $32,740 | $2,651,272 | $1,193,071 | $1,458,201 |
| 2019 | $31,781 | $2,572,635 | $1,157,685 | $1,414,950 |
| 2018 | $31,297 | $2,522,192 | $1,134,986 | $1,387,206 |
| 2016 | $29,870 | $2,424,254 | $1,090,914 | $1,333,340 |
| 2015 | $29,440 | $2,387,840 | $1,074,528 | $1,313,312 |
| 2014 | $29,548 | $2,341,067 | $1,053,480 | $1,287,587 |
Source: Public Records
Map
Nearby Homes
- 13226 Paxton St
- 13116 Weidner St
- 13063 Louvre St
- 12953 Montford St
- 11552 Fellows Ave
- 11602 Fellows Ave
- 13086 Eustace St
- 13079 Eustace St
- 11718 Borden Ave
- 12937 Van Nuys Blvd
- 13125 Pinney St
- 13110 Pinney St
- 11819 Chivers Ave
- 13250 Mercer St
- 11080 De Foe Ave
- 11887 Sproule Ave
- 12601 Van Nuys Blvd Unit 256
- 12601 Van Nuys Blvd Unit 138
- 12601 Van Nuys Blvd Unit 220
- 11125 Glenoaks Blvd
- 13221 Paxton St
- 13216 Paxton St
- 13210 Paxton St
- 13201 Daventry St
- 13215 Paxton St
- 13177 Daventry St
- 13207 Daventry St
- 13171 Daventry St
- 13215 Daventry St
- 13206 Paxton St
- 13209 Paxton St
- 13167 Daventry St
- 13200 Paxton St
- 13203 Paxton St
- 13161 Daventry St
- 0 Herrick Ave
- 11115 Herrick Ave
- 13174 Paxton St
- 13155 Daventry St
- 11371 De Foe Ave